
Branding Yourself as a Data-Driven Professional – Why It Matters…
If you’re like most people, when you think about the idea of branding yourself as a data-driven professional, your next thought goes something like, “me,

If you’re like most people, when you think about the idea of branding yourself as a data-driven professional, your next thought goes something like, “me,
If you’re like most people who work with data on a regular basis, you’re probably hearing about data science as a career change option and

Quickly Learn to Make a Recommendation Engine in Python [Course] Welcome from Introduction to Python Recommendation Systems for Machine Learning by Lillian Pierson,

(Preface: Today’s post is a guest post that was written by Aaron Gendle, a Senior Consultant and Data Architect at Eccella. In this post he

Last Thursday I had the pleasure to work with IBM for their Fast Track Your Data event in Munich, Germany. In 48 sweet hours we

Of These Top 20 Free Analytics Tools My Favorite is (Drum Roll, Please…) Just last week, Sam Scott published a very helpful article called “16 Free

Google Bought Kaggle: With Benevolent or Nefarious Intentions? Last Wednesday, on the Google Cloud Platform Blog, Fei-Fei Li (Chief Scientist of AI/ML, Google Cloud) announced

Custom Web-Based Data Visualizations Using Plotly and R Notebooks Want to build awesome interactive, web-based, collaborative data visualizations for free using R? You can do

In today’s post, you’re going to get an introduction to a new platform that makes it easier to manage and implement a fast big data
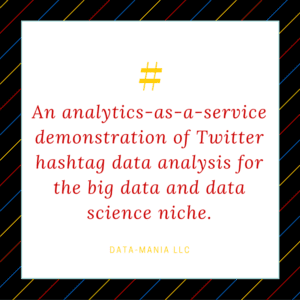
For our last installment in this 3-part series on analytics-as-a-service, I’m going to provide you a quick and dirty demonstration of how to use Watson
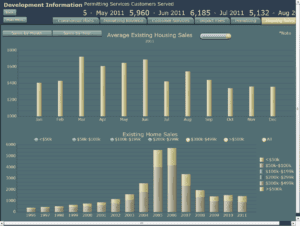
If you find yourself at meetings and are still asking yourself “What is a dashboard?”, then don’t be embarrassed! The majority of business professionals in

5 Easy Steps to Using R and Google Analytics for Online Marketing Improvements Do you want to use your data to improve the results of

dRecently, predictive modeling platform Kaggle hosted a Big Data Combine competition to predict short term changes in the prices of stocks. The competition was hosted

(A vlog post on data analytics) This vlog piece was filmed in Penang, Malaysia and introduces viewers to the 4 types of data analytics. The

Analytics Without Programming, DataSmart can Teach You How… Are you an Excel-wielding business analyst who’s on the lookout for new ways to generate data analytics

Hey ya’ll, just checking in real quick to give you a quick recap and heads up about next week’s vlog installments. This last week I
https://www.youtube.com/watch?v=LUfpOrOMXVI&feature=youtu.be In today’s video, you’ll learn some core differences between business intelligence and data science. [table colwidth=50″],Business Intelligence Data Sources,Mostly internal Technologies,OLAP / ETL /
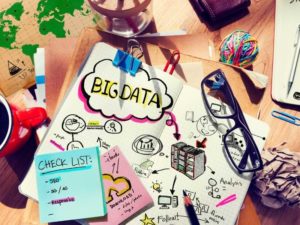
Data science explained in less than 4 minutes… The practice of data science is comprised of: Math / Statistics Time series analysis Regression analysis Decision
Hey, hey, hey… Lillian here! Big news! I am starting a YouTube series as a fun way to teach and educate people about data science
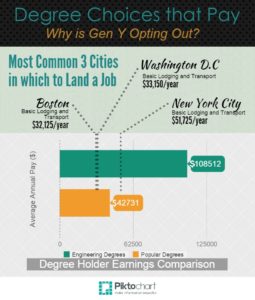
This month’s engineering statistics story is all about Generation Y young people and the decisions they’re making when it comes to choosing a career path.
