
It might surprise you to hear that AI traffic can convert at 14.2% versus 2.8% from old-school organic search, while 80% of LLM citations point to pages outside Google’s top 100 for the same query. In other words, if I only watch search rankings, I miss where buyers now find vendors.
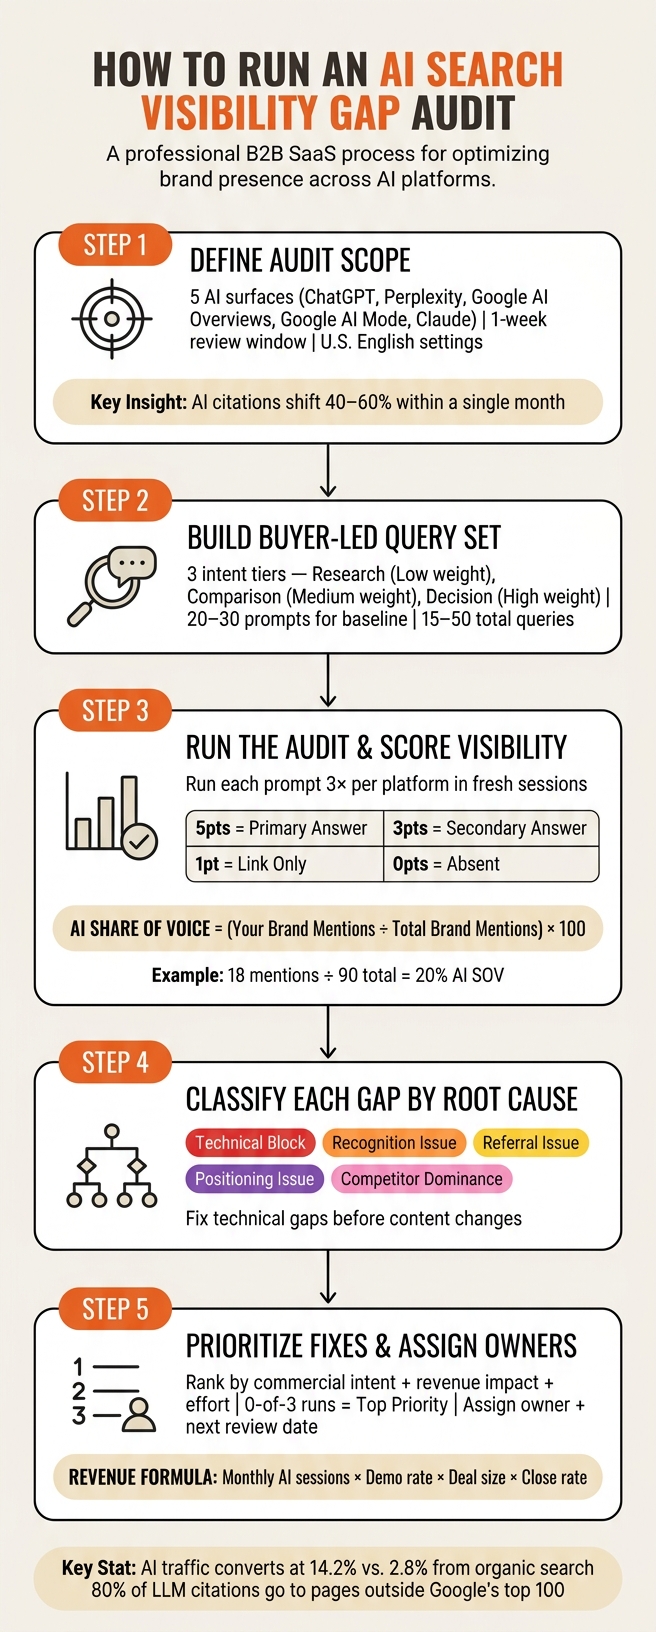
If I want a clean way to check AI visibility and rankings, I need to do five things: pick the AI surfaces, lock a 1-week review window, build a buyer-led prompt set, score mentions and citations the same way every time, and rank gaps by revenue impact. The point is simple: I compare where my brand shows up in AI answers versus where competitors show up, then I turn those gaps into assigned fixes.
Here’s the whole process in one quick view:
- Set scope first
- Track the same AI surfaces each cycle
- Use the same language and region settings
- Keep the review window to one business week
- Build the right prompts
- Use research, comparison, and decision intent
- Focus on 15 to 50 queries
- Start with 20 to 30 prompts for a baseline run
- Test for variance
- Run each prompt 3 times per platform
- Use a fresh session for each run
- Log mentions, citations, competitors, and answer position
- Score visibility
- 5 points for primary answer
- 3 points for secondary answer
- 1 point for link-only presence
- 0 points for no presence
- Classify the gap
- Technical block
- Recognition issue
- Referral issue
- Positioning issue
- Competitor dominance
- Prioritize fixes
- Rank by commercial intent, revenue impact, and effort
- Treat 0-of-3 runs as top priority
- Assign an owner and next review date
A simple formula sits underneath this: AI Share of Voice = (Your Brand Mentions ÷ Total Brand Mentions in the Prompt Set) × 100. So if I appear 18 times out of 90 total mentions, my AI SOV is 20%.
| Step | What I’m checking | What matters most |
|---|---|---|
| Scope | Platforms, entities, time window | Consistency |
| Query set | Buyer prompts by intent | Revenue fit |
| Audit runs | 3 runs per prompt per platform | Variance control |
| Scoring | Presence and citation strength | Comparable scoring |
| Gap review | Root cause by type | Clear next action |
| Follow-up | Owner and review cadence | Repeatability |
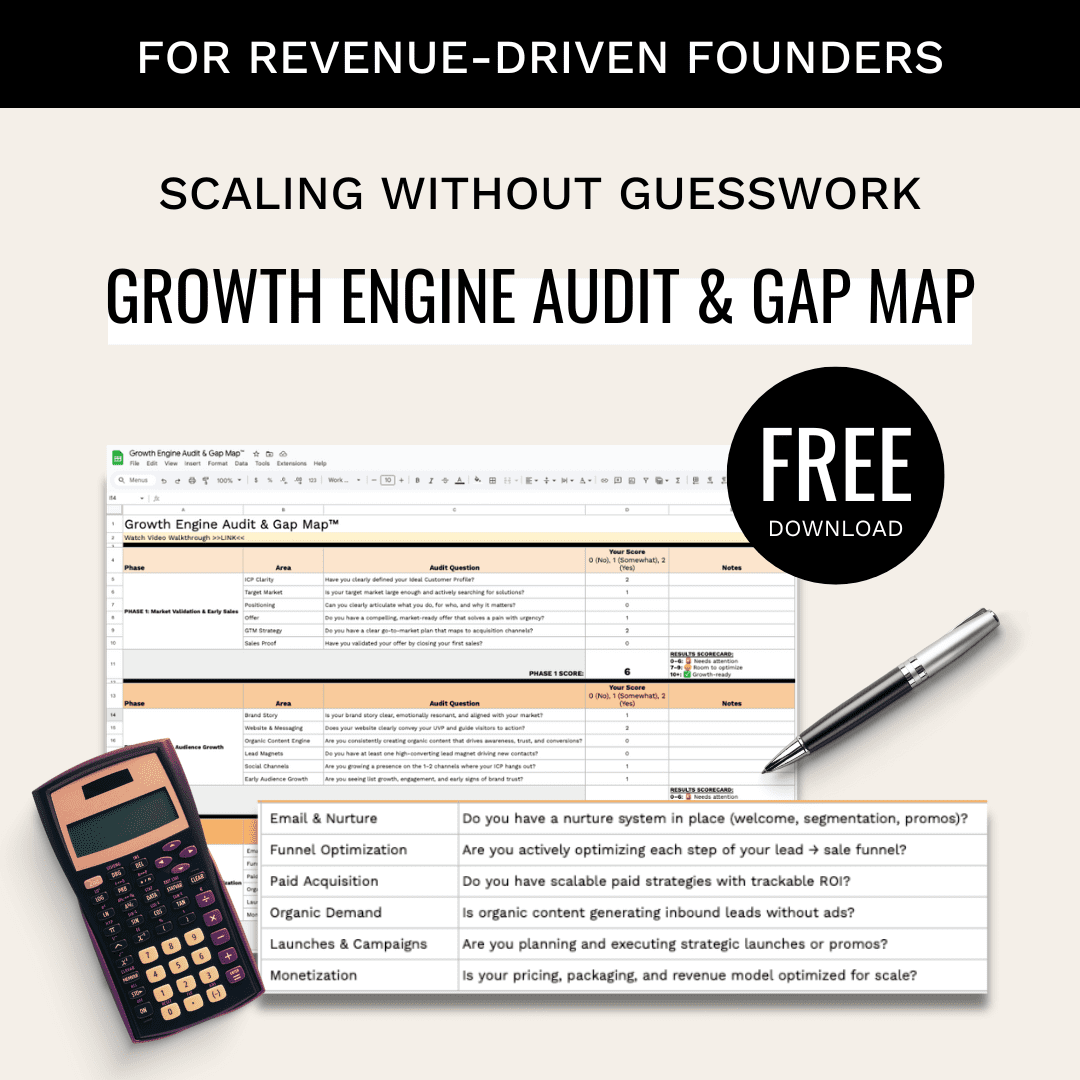
The good news is this audit doesn’t need a giant team or a pile of software. I can run it on a schedule, track one score over time, and use the template as a working loop instead of a one-off report.
AI Search Visibility Gap Audit: 5-Step Process
How To Do an AI Search Optimisation Audit (Step-by-Step Guide)
1. Define the Audit Scope Before You Collect Data
Scope creep can water down an audit before you even begin. Define what you’ll measure, where you’ll measure it, and how you’ll score visibility before you run a single prompt.
Choose the AI Surfaces, Entities, and Review Window
Your audit should cover five core AI surfaces: ChatGPT (including Search/OAI-SearchBot), Perplexity, Google AI Overviews, Google AI Mode (Gemini), and Claude (via Brave index) [1][6]. A fixed platform set makes each audit run easier to compare over time.
For brand entities, spell out every term you’re tracking: your brand name, product names, authors, and named frameworks [1][7]. Loose entity definitions create blind spots and lead to missed mentions.
Keep the audit window to one business week. AI citations for the same query can shift 40% to 60% within a single month [2], so a longer window adds noise and makes month-over-month comparisons messier. Use the same platforms, U.S. English settings, and scoring rules every time.
Repeat the same prompt set on the same schedule. In other words, consistency matters more than one oversized sample.
Visibility on one platform doesn’t tell you much about another, so you need to audit multiple surfaces [6][7]. Once you’ve locked the audit boundary, set weights based on revenue impact.
Set Business Rules for Priority and Weighting
Some queries matter far more than others. A prompt about pricing or implementation can affect pipeline much more than a broad awareness question, so your audit should reflect that.
Group your queries into three intent tiers: research-intent (educational, top-of-funnel), comparison-intent (evaluating alternatives), and decision-intent (purchase-ready) [5]. Give more weight to later-stage, high-value, ICP-fit queries than to raw search volume [1][6].
| Query Type | Example | Weight |
|---|---|---|
| Decision-intent | "pricing, setup, or implementation questions for [category]" | High |
| Comparison-intent | "[Brand] vs. [Competitor]" | Medium |
| Research-intent | "how does [category] work" | Low |
Estimate pipeline value for each query cluster by multiplying projected AI-referred sessions by demo rate, average deal size, and close rate [1]. That weighting should shape your final query sample.
2. Build a Query Set That Reflects Real Buyer Intent
Start with the weighted query clusters from Section 1 and turn them into actual prompts. This is where you find the buyer queries where AI engines leave your brand out.
Organize Prompts by Funnel Stage and Commercial Value
Write each prompt the way a real prospect would say it. AI systems often rewrite prompts before retrieval, so the wording your buyers use matters [3].
Build prompts across problem discovery, category evaluation, vendor comparison, pricing, implementation, and trust validation. Use both branded and unbranded terms so the audit shows where your brand drops out at each buying stage [2].
Use the table below to map each funnel stage to prompt ideas:
| Funnel Stage | Prompt Type | Example Query |
|---|---|---|
| Awareness | Problem Discovery | "How to automate B2B invoice processing" |
| Consideration | Category Evaluation | "Best AI-powered CRM for mid-market SaaS" |
| Decision | Vendor Comparison | "[Brand A] vs [Brand B] for security compliance" |
| Decision | Trust Validation | "Is [Brand A] SOC 2 Type II certified?" |
| Decision | Implementation | "How long does it take to deploy [Brand A]?" |
Once you’ve built the prompt library, cut it down to the highest-value queries and test those more than once.
Select a Final Audit Sample of 15 to 50 Queries
For most founder-led or small growth teams, a baseline audit starts with 20 to 30 prompts [2]. A set of 50 prompts gives you a solid snapshot of category-wide visibility [6].
Run each prompt at least three times per platform. AI responses vary, and repetition helps you tell the difference between a real visibility gap and random drift. It also gives you a steadier read on brand presence [5].
From there, run the sample across platforms and score each response in the worksheet.
3. Run the Audit and Score the Visibility Gap
Once you’ve locked the sample set, run every prompt the same way and record every response. Use more than one run. AI outputs shift, so the same prompt can produce different citations, brand mentions, and competitor names from one attempt to the next [5].
Run each prompt three times per platform in a fresh session [6].
Capture Answer Data in a Consistent Worksheet
For each run, log the response in one fixed spreadsheet. Keep the format identical every time so your scoring stays clean.
Each row should include:
- prompt
- platform
- run number
- brand mention (Y/N)
- citation URL
- competitors present
- accuracy
- gap type
Then score each run with the same rubric.
Score Presence, Citation Coverage, and Weighted Share of Voice
Use one scoring rubric across every response:
| Score | Condition | Example |
|---|---|---|
| 5 points | Primary answer | "Brand X is the leading option for…" |
| 3 points | Secondary answer | "Other reputable options include Brand Y…" |
| 1 point | Link only | URL appears in sources, but brand isn’t named in the text |
| 0 points | Absent | No mention, no link, no presence |
To calculate AI Share of Voice (SOV), use this formula: (Your Brand Mentions ÷ Total Brand Mentions in Prompt Set) × 100 [4].
In other words, if your brand shows up 18 times across a prompt set with 90 total brand mentions, your AI Share of Voice is 20%. That gives you one number you can track over time and compare against competitors using the same prompts.
Classify Each Gap by Root Problem
After scoring, group each gap by root cause. This part matters because each gap points to a different fix.
| Gap Type | Signal | Cause |
|---|---|---|
| Technical | 0% visibility across all runs | Robots.txt blocking AI crawlers or server errors [1] |
| Recognition | Cited but not named | Weak entity signals or missing Organization schema [1][2] |
| Referral | Named but not linked | No citation-ready page for the AI to anchor a citation to [2] |
| Positioning | Inaccurate or weak description | Inconsistent messaging across third-party sources [1] |
| Dominance | Competitors appear in more runs or hold higher positions | Competitors have more citations and stronger distribution [1][2] |
The good news is this keeps you from guessing. If you have a Technical gap, fix that first. If the issue is Recognition or Referral, your next move sits in entity signals, schema, or citation-ready pages. If it’s Dominance, you’re dealing with a distribution problem, not just a content problem.
Fix technical gaps before you touch content changes. Then use these root causes to rank fixes in the next step.
4. Prioritize Fixes and Map Them to Actions
Once you classify each gap, shift from diagnosis to action. Some gaps hit revenue harder than others, so they should go first.
Rank each gap by commercial intent, revenue impact, and implementation effort. That gives you a clean way to decide what to fix first instead of treating every issue like it has the same weight.
For revenue impact, use this formula: monthly AI-referred sessions × demo request rate × average deal size × close rate. It turns a visibility issue into a revenue-ranked task.
Score effort as low, medium, or high based on two things:
- How fast the fix can ship
- How much cross-team work it needs
Run your top 10 prompts three times. Treat 0-of-3 as the top priority. Treat 1-of-3 or 2-of-3 as a partial gap.
Map Each Gap Type to a Corrective Action
At this point, each root cause should map to one fix, one owner, and one review rhythm. Put each ranked gap against the action below.
| Gap Type | Likely Root Cause | Recommended Fix | Owner | Review Cadence |
|---|---|---|---|---|
| Technical Block | robots.txt or CDN settings blocking AI crawlers |
Unblock GPTBot, PerplexityBot, and ClaudeBot; verify 200 server responses | Dev/Web Ops | Weekly |
| Missing Brand Mentions | Content gap or missed prompts | Create dedicated comparison or category pages | Content Team | Monthly |
| Weak Citations | Weak page structure or unclear answers | Lead with the answer; add FAQPage schema; increase statistics density |
SEO/Content | Weekly |
| Entity Confusion | Inconsistent brand naming or missing schema | Standardize Organization schema and update third-party profiles |
Technical SEO | Quarterly |
| Poor Intent Coverage | Missing sub-topic depth for buyer-stage queries | Map buyer-intent queries; update H2 headings to mirror buyer questions | SEO Team | Monthly |
| Outdated Pages | Stale data or missing publication dates | Refresh with current statistics and measured signals | Content Team | Quarterly |
The goal here is simple: close gaps faster. Add the ranked fixes to the template, assign each owner, and set the next review date.
Use these rankings and fixes to fill in the template in the next step.
5. Use the Template as a Recurring Audit Loop
Once you’ve scored and ranked the gaps, use the template as a repeatable operating loop.
A one-time audit gives you a snapshot. A recurring audit shows whether your visibility is moving in the right direction.
How to Use the Template Step by Step
Use the template in the same order every cycle:
- Paste your query bank: Use the same prompts every cycle. If you swap prompts, you lose clean longitudinal data.
- Run each prompt 3 times: Patterns matter. One run is just noise.
- Log outputs: Record presence, citation type, and position for each run in the Data Log tab.
- Score each row: Calculate your weighted Share of Voice and AI Visibility Score in the Scoring Summary tab.
- Assign priority: Pull your ranked gaps from Section 4 into the Remediation tab. Give each gap a type, an owner, and a due date.
- Track remediation: Mark fixes as complete, then re-test those prompts in the next cycle to confirm the gap closed.
Run crawler access checks weekly, score citations monthly, and rerun the full template quarterly. That rhythm keeps the data current without burying a lean team in busywork.
Conclusion: The Minimum Viable Process to Improve AI Search Visibility
The goal isn’t a one-off report. It’s a repeatable system for closing gaps. This process is the foundation for how to show up in AI search consistently.
Here’s the core discipline: lock the query set, test across the same AI surfaces, measure weighted Share of Voice, sort each gap by root cause, and rank fixes by revenue relevance. Then turn the audit into a monthly loop. Score the same prompts, rank gaps by revenue impact, assign owners, and rerun until the gap closes.
FAQs
tools to identify AI search visibility gaps and improve visibility
Start with a simple measurement setup. Use the Bing AI Performance dashboard to track grounding queries, run manual audits across ChatGPT, Perplexity, Google AI Overviews, and Claude, and log the places where competitors show up and your brand doesn’t.
For visibility, make your content easier for AI systems to pull from. Use question-led H2s, clear definitions, and verified stats. Also allow AI crawlers in robots.txt, and set up a GA4 custom channel group so you can split AI traffic from direct visits.
measure share of voice AI powered search B2B marketing
To measure Share of Voice (SoV) in AI-powered search for B2B marketing, track how often your brand shows up compared with competitors across a set of high-intent buyer prompts.
AI engines are stochastic, so you need to account for variation. Run each prompt at least three times per platform to get a steadier read.
Calculate SoV with this formula: (Your Brand Mentions ÷ Total Brand Mentions in the Same Prompt Set) × 100.
Then pair that number with citation rate and average recommendation rank so you can track visibility over time.
B2B share of voice AI-powered search
B2B share of voice in AI-powered search shows how often your brand gets cited compared with competitors across AI engines for a set of high-intent prompts. Since results can change from one run to the next, pull multiple samples per prompt.
A common formula is (your brand citations ÷ total citations in the same prompt set) × 100. Track mentions separately from citations. Then monitor these prompt groups every week:
- Category education
- Branded comparisons
- Competitor brand terms
Related Blog Posts
- Show Up in AI Search Results in <2 Weeks: Step-by-Step Guide (2026)
- AI Search Analytics: The Metrics + Dashboard You Need to Track LLM Visibility
- AI Search Visibility Tools & Metrics: What to Buy (and the Metrics That Actually Matter)
- How to Set Up an AI Search Visibility Dashboard: Metrics, Tools & Reporting Cadence