
If your sales cycle runs 6+ months, your current quarter is mostly locked in already. I’d build forecast accuracy by working backward from the revenue target, then tying that target to the number of qualified accounts, opportunities, and closed deals I need 2 to 3 quarters earlier.
In other words, I wouldn’t lean on stage percentages and rep close dates. I’d use segment-level close rates, median cycle length, cohort tracking, and weekly buyer engagement signals. That gives me a cleaner way to plan pipeline, spot stalls, and keep demand spend steady even when the current quarter feels shaky.
Here’s the simple version:
- Measure the sales cycle by segment, not as one blended average
- Split by ACV, source, and inbound vs. outbound
- Use p25, median, and p75 to see what “normal” looks like
- Start with the revenue goal, then calculate using a B2B pipeline tracker:
- deals needed
- opportunities needed
- qualified accounts needed
- Shift the target back by cycle length
- A 7-month median cycle means Q4 revenue depends on Q2 pipeline creation
- Track by entry cohort quarter, so you can see conversion at 3, 6, 9, and 12 months
- Score deal health with buyer signals like:
- breadth
- depth
- recency
- momentum
- Flag deals with no buyer action for 45 days
- Treat demand gen as a fixed monthly commitment, because long-cycle revenue shows up later
A simple example makes the math click fast:
- $1,200,000 quarterly target
- $80,000 average deal size
- 22% opportunity-to-close rate
- 40% qualified-account-to-opportunity rate
- 7-month median cycle
That maps to:
- 15 closed deals
- 68 opportunities
- 170 qualified accounts
The good news is that this gets a messy forecast into plain math. I’ve seen the same logic hold in long-payback growth work too. For example, at SingleStore, I built an always-on organic engine that drove 1,100+ organic MQLs at $50 CPL over 10 months with $0 in paid ad spend (the SingleStore case study). However, the point isn’t the channel. It’s the timing. With long cycles, the work you fund now tends to hit revenue quarters later.
This piece boils the article down to one working idea: forecast from buyer reality and timing, then fund the volume that model requires.
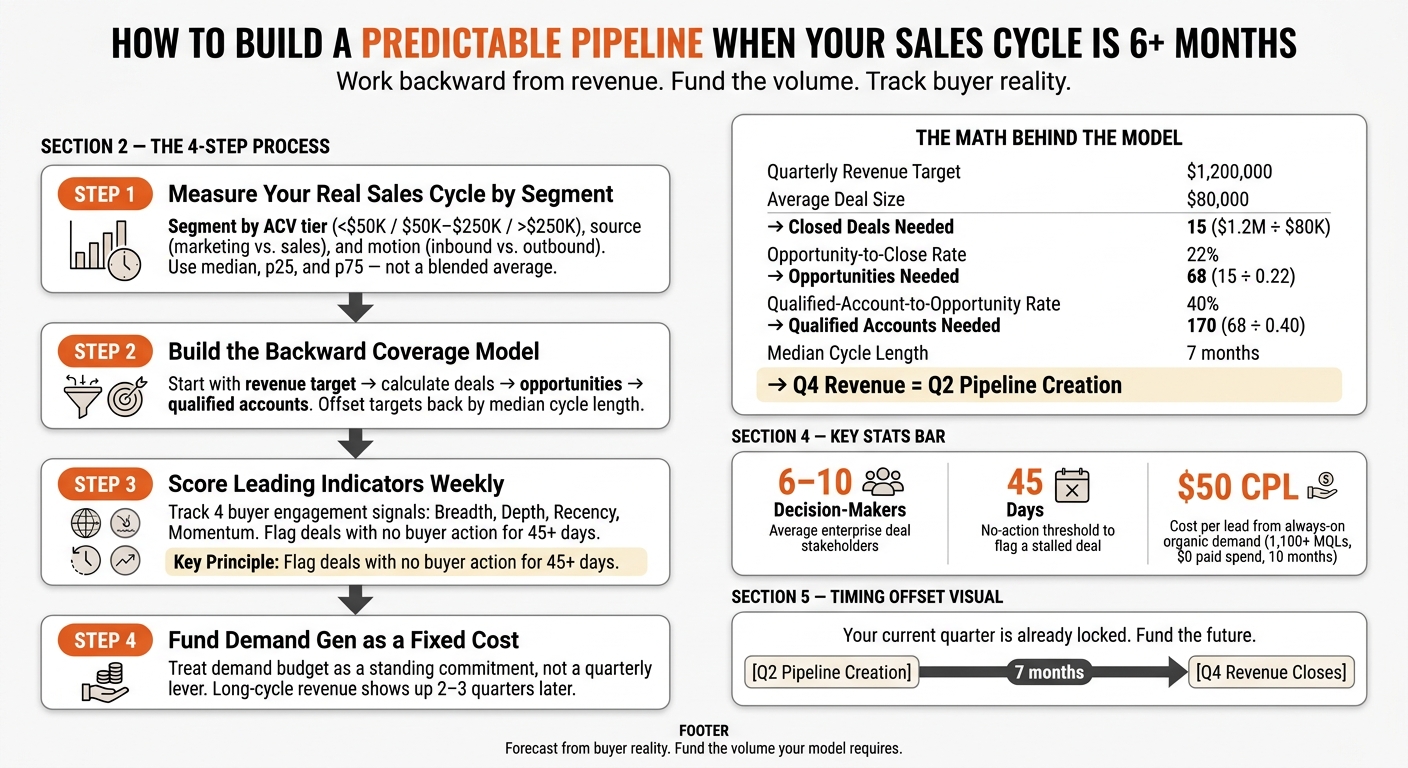
How to Build a Predictable Pipeline for 6+ Month Sales Cycles
How to measure B2B marketing for companies with long sales cycle
Step 1: Measure your real sales cycle by segment
A blended average cycle length breaks long-cycle forecasts. Mix a short SMB deal with a long enterprise deal, and you get a number that fits neither one. That means every conversion rate and coverage target built on top of it starts off wrong.
Segment by ACV, source, and inbound vs. outbound
Start with your closed-won deals and group them into three practical ACV tiers:
- Under $50,000
- $50,000 to $250,000
- Over $250,000
Then split each tier by source, marketing-sourced vs. sales-sourced, and by motion, inbound vs. outbound. These cuts matter because cycle length and conversion rate can split hard across segments.
Measure from the date the account became a qualified opportunity to the close date. Don’t use lead creation. Lead creation often tracks rep logging habits, not buyer timing.
Use median, p25, and p75 instead of a single average
For each segment, calculate p25, median, and p75. The median shows the typical cycle length. The gap between p25 and p75 shows what normal variation looks like for that segment.
That range gives you a clean baseline for judging deal health. If a deal sits inside the band, it’s likely normal. If it moves past p75, treat it as stalled.
Lock your definitions for qualified account, qualified opportunity, and dead deal before you report cycle length. Otherwise, the data will reflect rep activity instead of buyer behavior.
With segment-level cycle bands in place, you can now work backward into the pipeline volume each quarter needs.
Step 2: Build the backward coverage model
Start with the revenue target, then work backward through each conversion rate until you land on the qualified-account volume you need. Use the cycle bands from Step 1 as the inputs for each segment-level calculation.
Calculate deals, opportunities, and qualified accounts needed
Run the math for each ACV segment on its own. Use the median close rate for that segment, not a blended rate. The chain is simple[1][3]:
- Revenue target ÷ average deal size = closed-won deals needed
- Deals needed ÷ opportunity-to-close rate = opportunities needed
- Opportunities needed ÷ qualified-account-to-opportunity rate = qualified accounts needed
This is where the model starts to click. You stop guessing how much pipeline you need and start seeing the exact account volume behind the number.
Offset targets by cycle length and tag by entry cohort
Once you know how many qualified accounts each segment needs, shift that target back by the median cycle length. If your median cycle is 6 months, Q4 revenue depends on Q2 pipeline creation.
Tag each opportunity by the quarter it entered the pipeline, not the quarter you expect it to close. That entry cohort quarter gives you a cleaner read on performance. You can track what share of a quarter’s pipeline converted at the 3-, 6-, 9-, and 12-month marks and spot changes based on when the work actually happened[2].
A worked example with sample numbers
Here’s what the model looks like for one quarter:
| Input | Value |
|---|---|
| Quarterly revenue target | $1,200,000 |
| Average deal size | $80,000 |
| Opportunity-to-close rate | 22% |
| Qualified-account-to-opportunity rate | 40% |
| Median cycle length | 7 months |
Step 1: $1,200,000 ÷ $80,000 = 15 closed deals needed
Step 2: 15 ÷ 0.22 = 68 opportunities needed
Step 3: 68 ÷ 0.40 = 170 qualified accounts needed
Timing offset: A Q4 revenue target maps back to pipeline creation in Q2 of the same year when your median cycle is 7 months.
That gives you the monthly demand requirement. Once that volume target is set, the next job is to check whether the pipeline still has enough health to hit it.
Step 3: Use leading indicators to keep the model honest
Leading indicators tell you if today’s pipeline still has a pulse. This is your control layer. It checks whether the backward model still lines up with what’s happening right now. Start with a weekly score so you can see if the live pipeline is still moving.
Score account engagement instead of relying on deal stage
Deal stage reflects rep belief; engagement reflects buyer intent. A stage means something only after the buyer takes a meaningful action.
Score each deal every week across four signals:
- Breadth: How many distinct contacts are engaged
- Depth: Whether the economic buyer has engaged
- Recency: Days since the last buyer action
- Momentum: The 30-day trend
Roll those into one health score that sits apart from CRM stage.
Enterprise deals now involve an average of 6–10 decision-makers [1], so single-threaded deals break easily. Aim for at least one executive sponsor, one to two champions, and three to five evaluation team members engaged before you treat a deal as late-stage [3]. That score helps you spot the difference between deals that are alive and deals that are just parked in stage.
Set stall thresholds and require a next action
Inflated open pipeline is what makes your coverage ratio lie. If a deal has no buyer action for 45 days, flag it. Then require either manager re-qualification or a return to nurture.
If a deal gets pushed twice in a quarter, move it from Commit to Best Case and require re-qualification. When you can tie a stalled deal back to a specific entry cohort, you can see where the issue started. Was it sourcing? Qualification? Or did something change mid-cycle?
Run a rolling four-quarter review every month
Once a month, run three checks against a four-quarter forward view.
- Did any segment’s conversion rate move outside its historical range?
- Is the cohort two quarters out converting at the same pace as older cohorts at the same age?
- What one assumption are you changing this month?
Log every change with a date. If the forecast misses, you can trace the error to a specific decision instead of waving it away as vague "market conditions."
Once the live pipeline is scored and stalled deals are forced out, size the demand engine to the account volume the model requires.
Step 4: Fund the demand engine and check that the system is producing pipeline, not just activity
Treat demand generation as a fixed cost, not a quarterly lever
A 6+ month sales cycle turns demand budget into a standing commitment. It does not work like a switch you flip each quarter. The backward coverage model from Step 2 gives you a hard number: how many qualified accounts you need each month to hit pipeline velocity and revenue targets.
That target stays the same even when the current quarter feels shaky. If your team sells on a 15-month cycle, you won’t fix the quarter from inside the quarter. In other words, the move isn’t to chase the moment with extra spend. The move is to keep funding the account volume your model says you need.
A first-party proof point: 1,100+ organic MQLs at $50 per lead
This is where always-on demand earns its keep. Channels with a long payback window need time before revenue shows up. If you keep them funded, they build momentum.
I built an always-on organic demand engine for SingleStore that generated 1,100+ organic MQLs at $50 cost-per-lead over 10 months, with zero paid ad spend. That result came from an always-on organic system built for a long payback window.
For 6+ month cycles, the demand you fund today tends to show up in revenue two to three quarters later. That leads to the next check: whether those accounts are moving through the pipeline, or whether you’re just logging activity.
FAQs
How long does it take to build a predictable pipeline model?
It takes 4 to 6 weeks to stand up a predictable pipeline model, and about one quarter to calibrate it.
The mechanism is simple: work backward from the revenue target. Start with average deal size and conversion rates, then map the account engagement volume you need 2 to 3 quarters ahead.
In other words, if the revenue number is fixed, the inputs have to earn their way there. That gives you a model you can actually use, not just a spreadsheet that looks nice in a board deck.
Refresh it weekly so you can catch slippage early and adjust before it turns into a quarter-end problem.
How much historical data do I need before the numbers are trustworthy?
Use enough historical data to build a backward-looking coverage model from your quarterly revenue target, average deal size, conversion rates, and median cycle length. That lets you line up current account creation with the revenue you expect two to three quarters out.
The math matters, but the mechanism matters more. Start with the revenue target, work backward through deal size and stage conversion rates, then pressure-test the timing with median cycle length. In other words, you’re asking a simple question: how many accounts do you need in motion now to hit the number later?
To keep the numbers trustworthy, define stages around verified buyer actions. Set clear exit criteria, document them, and make sure the team uses the same standard every time. If a deal gets pushed twice in-quarter, auto-demote it from Commit so the forecast reflects what’s happening, not what everyone hopes will happen.
Refresh the model weekly to catch slippage early. A weekly review gives you time to spot gaps in coverage, weak account creation, or deals that stall before they distort the quarter.
Do I need a marketing automation platform, or can I do this in a spreadsheet?
You can do this in a spreadsheet when you have reliable historical data and a backward coverage model.
Start with your quarterly revenue target. Divide it by average deal size, adjust for segment-level conversion rates, and then offset it by your median sales cycle length. In other words, you work backward from revenue to pipeline, then from pipeline to the timing you need.
A marketing automation platform helps you track account-level engagement, and that gives you a better read on deal momentum. However, the bigger shift is this: move away from stage-based forecasting and run weekly reviews of leading indicators instead.
That means you watch signals like engaged accounts, sales-accepted opportunities, meeting volume, and pipeline creation rate, rather than leaning too hard on a static stage report. The good news is that this gives you a forecast that reflects what is happening now, not what looked fine two weeks ago.
Treat the forecast as a range, not a single number. That approach fits the messiness of B2B revenue planning a lot better, especially when segment mix and cycle length can shift within the quarter.
What if my sales cycle length varies wildly between deals?
Measure cycle length by segment: deal size, source, and inbound vs. outbound. Use the median and the 25th to 75th percentile range so you can see what a normal sales path looks like for each group. A single blended average hides too much, especially when one large enterprise deal can throw off the whole picture.
Then work backward from your revenue target through conversion rates to estimate the account engagement volume you need two to three quarters ahead. In other words, start with the outcome, trace it through each stage, and figure out how much pipeline activity has to exist early enough to hit the number.
Stage probability alone won’t give you a clean forecast. Use CRM stage history, engagement signals, and cohort conversion checks to see whether deals are moving the way they should.
What if I don’t have 30 closed deals yet?
If you don’t have 30 closed deals yet, build the model anyway. Just treat it as directional, not dependable. The good news is that you can still get signal from a smaller sample if you stay strict about how you use it.
Segment the data you do have. Use median cycle length instead of blended averages, and forecast backward from your revenue target to the number of opportunities you need. In other words, start with the outcome, then map the pipeline required to get there.
To keep the forecast useful, anchor stage changes to buyer-verified movement. Track weekly leading indicators, and run a weekly forecast scrub so stalled or pushed deals don’t warp your coverage.
Should I try to shorten my sales cycle instead?
For a 6+ month sales cycle, the move is to build a predictable pipeline by working backward from your revenue target, conversion rates, and median sales cycle length.
In other words, start with the number you need to hit, then map the deal volume and timing that make that number possible. That gives you a planning model you can actually use, instead of a forecast that falls apart the minute close dates slip.
Split your forecast by ACV and source. A $15,000 inbound deal and a $150,000 outbound deal do not move at the same pace, and they should not sit in the same bucket.
Use median cycle length instead of a blended average. The median gives you a cleaner view of how deals move, especially when a few outliers drag the average all over the place.
Then anchor the forecast to buyer-verified actions and weekly activity signals, not rep-set close dates. When a buyer has confirmed budget, joined a security review, pulled in legal, or scheduled next-step meetings, you have signal. A rep saying a deal should close this month is not the same thing.
How is this different from standard pipeline coverage ratio forecasting?
Forecast from a coverage model, then work backward.
Start with your quarterly revenue target. From there, reverse-engineer the math through average deal size, conversion rates, and median sales cycle length. That gives you a clear estimate of how many qualified accounts you need 2 to 3 quarters earlier.
In other words, you stop treating the pipeline like a guessing game and start treating it like a system. If the target is $1,000,000 for the quarter and your average deal size is $50,000, you need 20 closed deals. If your conversion rate from qualified account to closed-won is 10%, you need 200 qualified accounts in motion far earlier than the quarter you want to hit.
Also, swap stage-probability forecasting for account engagement signals. Review leading indicators every week instead of leaning on rep-entered close dates. Rep judgment still matters, of course, but engagement data gives you a firmer read on what’s live, what’s stalling, and where risk is building.
That shift turns forecasting from a lagging outcome into a managed process.
What if my forecast is still wrong after two quarters?
Start with the inputs that drive the number, not just the deal stages. Forecast backward from your revenue target, then map the math by segment-specific close rates and the account engagement you need 2 to 3 quarters ahead.
Use buyer-verified actions in place of rep-logged activity. Review the forecast every week for stalls and close-date changes, and treat it as a range: Commit, Best Case, and Upside.
Related Blog Posts
- GTM Engineering Benchmarks 2026: Time-to-First-Revenue, CAC Payback, and Pipeline Velocity for B2B SaaS
- IT Services Firm GTM Benchmarks 2026: Pipeline Coverage Ratio, Win Rate by Vertical, and Sales Capacity Utilization
- The AI-Native Founder’s Build-to-Sell Stack: Tools to Ship and Sell an AI Product (2026)
- AI-Native GTM for Vertical AI Startups: Positioning & ABM Playbook (2026)