

Top-down market sizing starts broad and narrows down to your specific opportunity. It’s a great way to quickly estimate market potential, especially in established industries with solid data. Here’s the process in a nutshell:
- Start with TAM (Total Addressable Market): Use a reliable, high-level figure, like industry-wide revenue or total spending.
- Define SAM (Serviceable Available Market): Apply filters like geography, customer size, or product fit to narrow down your audience.
- Calculate SOM (Serviceable Obtainable Market): Estimate what percentage of SAM you can realistically reach in the short term.
This method works best when paired with bottom-up sizing for validation. If both estimates align within 15%, your assumptions are likely solid. However, top-down sizing isn’t perfect – it relies heavily on secondary data and broad assumptions, which can amplify errors. For niche or emerging markets, combine it with bottom-up for a clearer picture.
Want to avoid common pitfalls? Don’t overestimate your audience, mix up revenue and spend data, or confuse TAM, SAM, and SOM in your pitch. Always document your assumptions, test different scenarios, and cross-check your numbers for accuracy. By following these steps, you’ll build a market sizing model that’s clear, logical, and investor-ready.
Top-Down vs Bottom-Up Market Sizing
How the Two Methods Differ
Top-down and bottom-up market sizing approaches take fundamentally different routes to arrive at an estimate. Top-down begins with a broad, overarching figure – like total industry spending or GDP – and narrows it down using filters specific to your market opportunity [1][3]. Bottom-up, on the other hand, starts small, focusing on individual customers, their price points, and the total number of reachable customers, then scaling upward [1][4].
These starting points shape how the analysis unfolds. Top-down relies on secondary data sources like analyst reports, government statistics, and industry publications. This makes it quicker to execute but also more prone to broad assumptions [1][6]. In contrast, bottom-up uses primary data such as actual sales records, CRM data, or operational capacity, offering a more granular and customer-focused perspective [1][6].
| Feature | Top-Down Market Sizing | Bottom-Up Market Sizing |
|---|---|---|
| Starting Point | Broad industry or macroeconomic figures (TAM) | Individual customers and sales data |
| Data Sources | Secondary data (e.g., reports, stats) | Internal sales data, primary research, CRM |
| Primary Benefit | Quick execution, great for mature industries | Tailored to operational realities |
| Primary Risk | May miss finer details or micro-level issues | Small errors can compound into larger inaccuracies |
| Best For | Investors assessing pitches; geographic focus | Forecasting; launching disruptive products |
These differences make it clear that both methods bring unique strengths to the table. Combining them can provide a more balanced and precise market estimate.
Why You Should Use Both Methods
Using both top-down and bottom-up approaches together strengthens your analysis by validating key assumptions [1][6]. For example, when the results of both methods align within a 15% range, it indicates that critical assumptions – like pricing, adoption rates, and filters – are likely accurate [3]. However, if there’s a significant gap between the two, it’s a sign that those assumptions need a closer look.
“The top-down approach paints the bigger picture, while bottom-up offers a ground-level view rooted in operational reality. When both tell a consistent story, you can move forward with stronger conviction.”
Bottom-up analysis ensures that non-addressable revenue is excluded, keeping the projections realistic, while top-down sizing confirms whether the overall market size meets the threshold for materiality [3][6]. As Ian Taylor from Pear VC explains, “Ideally you will only use top-down to sanity check the magnitude of your bottom-up estimate” [7]. This combination bridges the gap between the macro-level insights investors value and the operational details that drive execution [1].
With these methods clarified, the next step is diving into the detailed 7-step process for top-down market sizing.
TAM SAM SOM Explained: How to Calculate Your Market Size
The 7-Step Top-Down Market Sizing Process
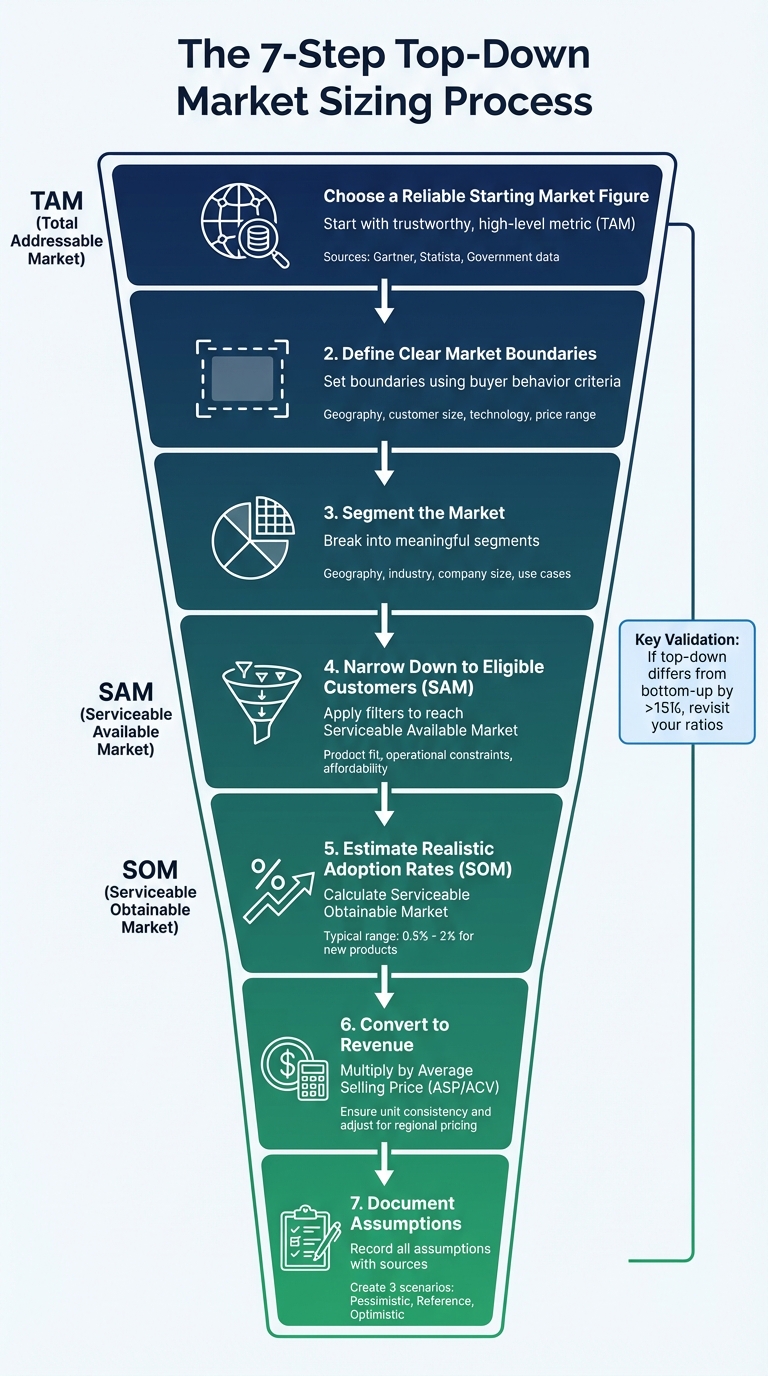
7-Step Top-Down Market Sizing Process: TAM to SAM to SOM
Top-down market sizing is a methodical approach that begins with a broad, macro-level figure and progressively narrows it down to a realistic revenue estimate. Each step refines the opportunity while keeping a clear record of the assumptions made along the way. Here’s how to work through the process step by step.
Step 1: Choose a Reliable Starting Market Figure
Start with a trustworthy, high-level metric that represents the full scope of your target market without including unrelated categories [3]. This figure should be broad enough to capture all potential demand but not so wide that it inflates your Total Addressable Market (TAM). Reliable sources include industry reports (like those from Gartner or Statista), government data (such as from the Bureau of Labor Statistics or OECD), and specialized research organizations [1][2]. For example, when estimating the market for residential solar inverters, use the total national rooftop photovoltaic (PV) capacity instead of overall electricity generation to avoid overstating the market [3].
The key is to ensure your data source is up-to-date, transparent, and backed by a clear methodology.
Step 2: Define Clear Market Boundaries
After identifying your starting figure, set clear boundaries to determine what falls within your market. Segment the market using criteria that reflect buyer behavior, such as geography, customer size, technology level, or price range [3]. For instance, if you’re sizing the U.S. specialty foods market (valued at $146 billion), decide whether your product competes across the entire category or just a subset, like plant-based foods (worth $7 billion) [5]. These boundaries should align with real-world purchasing decisions, excluding alternatives that buyers wouldn’t consider as substitutes.
Step 3: Segment the Market
Now, break the market into smaller, meaningful segments based on factors that significantly influence demand. Common segmentation dimensions include geography, industry, company size, or specific use cases [3][1]. For example, a meal kit service in the UK might start with all 28 million households as the TAM, then narrow it down using filters like urban location, broadband access, and disposable income. This process could reduce the relevant subset to 8.4 million households (30%) [1]. Limit the number of filters to avoid compounding errors.
Step 4: Narrow Down to Eligible Customers
This step refines your TAM into the Serviceable Available Market (SAM) – the subset of customers your business can realistically reach and serve [1][8]. Apply filters based on product fit (ensuring your offering meets customer needs), operational constraints (whether your business model supports serving these customers), and affordability (whether customers can pay for your product). For example, a B2B SaaS tool might exclude companies with fewer than 50 employees if the product requires dedicated IT resources [3][1]. If customer ratios vary significantly by region or segment, use a matrix instead of a single global average for better accuracy [3].
Once SAM is defined, the next step is estimating how much of it you can capture.
Step 5: Estimate Realistic Adoption Rates
To calculate your Serviceable Obtainable Market (SOM), estimate the percentage of SAM you can realistically capture in the short term (typically 1–3 years) [2][1]. For new products, claiming a 10% capture rate in the first year is overly ambitious. Initial adoption rates often range between 0.5% and 2%, increasing as product-market fit improves and distribution grows [2]. Use real-world benchmarks to guide your expectations – like battery-electric vehicles, which are projected to reach 19% of global new car sales in 2024 [3].
Step 6: Convert to Revenue
Once SOM is calculated in terms of customers or units, translate it into revenue by multiplying it by your average selling price (ASP) or annual contract value (ACV) [2][3]. Ensure consistency in units and use a constant-currency base year to maintain clarity [3]. For example, clarify whether software pricing is per seat, per company, or usage-based. For physical goods, normalize units (e.g., converting kilowatts to megawatts) before applying pricing. Adjust for regional pricing differences – a SaaS product might cost $10,000 ACV in the U.S. but only $6,000 in emerging markets. Avoid relying on a single global average.
This step ties your unit estimates directly to revenue, setting the stage for thorough documentation.
Step 7: Document Assumptions
The final step is to document every assumption, including its source, confidence level, and sensitivity range [3]. Create three scenarios – pessimistic, reference, and optimistic – linked to specific triggers like regulatory changes or cost milestones [3]. Maintain a source log with details like ratio name, data origin, year, and reliability score (A–C) [3]. Perform sensitivity analysis by adjusting key ratios (±25%) to identify which have the largest impact. Ratios causing over a 10% variance are “swing ratios” that require further validation [3].
“Far better to simply call out the assumptions and outstanding questions than to portray 100% confidence.” – Michael W. Silverman [4]
If top-down estimates differ by more than 15% from bottom-up checks, revisit your initial ratios [3]. Proper documentation transforms your model from a black box into an auditable framework that stakeholders can quickly review.
| Documentation Component | Purpose | Best Practice |
|---|---|---|
| Source Log | Auditability | Include ratio name, source, date, and hyperlink [3] |
| Sensitivity Matrix | Risk Assessment | Highlight the top three “swing ratios” that drive variance [3] |
| Scenario Fan | Strategic Planning | Present pessimistic, reference, and optimistic outputs [3] |
| Change Log | Version Control | Record time stamps, editor initials, and rationale for edits [3] |
sbb-itb-e8c8399
Example: Sizing the Market for a B2B SaaS Analytics Tool
Let’s break down the market sizing process for a hypothetical B2B SaaS analytics platform aimed at mid-market companies in North America, using a structured seven-step approach.
Calculating the Base Case
The global analytics software market is currently valued at $50 billion annually. This figure represents the Total Addressable Market (TAM) [5][8].
Narrowing it down to North America and focusing on mid-market companies (organizations with 100–1,000 employees) reduces the market to 20% of the TAM, giving a Serviceable Addressable Market (SAM) of $10 billion. Assuming you capture 10% of this SAM, your Serviceable Obtainable Market (SOM) would be $1 billion [2][8][1]. To translate this into customer numbers, divide the SOM by your tool’s average contract value (ACV). If the platform costs $50,000 annually, this equates to approximately 20,000 customers.
The next step is to evaluate how changes in key assumptions can alter this projection.
Testing Different Scenarios
Since assumptions are rarely set in stone, creating a sensitivity table can help you see how shifts in key variables – like adoption rates or pricing – affect your SOM. Below is an example of how these adjustments impact revenue projections:
| Scenario | Adoption Rate | Annual Contract Value | Resulting SOM |
|---|---|---|---|
| Pessimistic | 5% | $40,000 | $500M |
| Base Case | 10% | $50,000 | $1B |
| Optimistic | 15% | $60,000 | $2.25B |
As shown, varying adoption rates by just 5 percentage points and pricing by $10,000 can swing the SOM by a staggering $1.75 billion. These ranges highlight which assumptions have the most influence on your projections. For example, if adoption rates cause more than a 10% variance in SOM, it may be worth revisiting and validating that assumption [3].
“The objective of target market sizing as an exercise is not to be precise, but to be accurate by order of magnitude.” – Michael W. Silverman [4]
To ensure your estimates are grounded, cross-check this top-down analysis with a bottom-up calculation. For instance, if you expect to reach 500 companies in your first year with a 40% close rate and an ACV of $50,000, you’d generate $10 million in year-one revenue. This serves as a useful benchmark against your longer-term SOM projection. If the top-down and bottom-up estimates differ by more than 15%, it’s a signal to revisit your underlying ratios [3].
4 Common Market Sizing Mistakes to Avoid
Steering clear of these frequent errors can help ensure your market size estimates hold up under scrutiny. Missteps in this area can weaken your forecasts and raise red flags with investors.
Claiming Everyone is Your Customer
Declaring an enormous Total Addressable Market (TAM) without proper filters can damage your credibility. This is often referred to as the “1% fallacy” – the idea that capturing just 1% of a massive market will lead to substantial revenue. However, when tech companies go public, they usually capture only 0.1% to 2% of their TAM [7].
To avoid this, use filters like company size, industry, technology adoption, and budget authority to define your actual target audience. These filters should be mutually exclusive and collectively exhaustive (MECE), meaning there’s no overlap and no gaps [3]. Interestingly, a survey of 30 venture capitalists found that many investors struggle to clearly define TAM, SAM, and SOM – making it even more critical to present a clear and methodical approach [7].
“Don’t be tempted to resort to hand waving, meaning don’t quote something you’ve heard and not verified as realistic.” – Marjorie Radlo-Zandi, Founder and Angel Investor [5]
Additionally, ensure your definitions don’t overlap, as this can lead to inflated estimates.
Counting the Same Customers Twice
Accurate segmentation is key, and overlapping segments can lead to double-counting. For instance, if you divide your market by “healthcare companies” and “companies with 500+ employees”, large healthcare firms could end up being counted twice, artificially inflating your Serviceable Addressable Market (SAM).
A better approach is to use hierarchical allocation. Start with a primary dimension like geography, then layer in secondary factors such as customer size or product tier [3]. Check that sub-segments are smaller than their parent markets – if a child segment is larger, it’s a sign of an error or overlap [4]. Running a quick “roll-up” check, where you sum all segments to ensure they match your initial TAM, can help validate your work [3].
Mixing Up Revenue and Spend Data
Confusing revenue with customer spend can lead to overestimated projections. Revenue reflects what your business earns, while spend shows what customers pay overall. To avoid this, base your calculations on your actual revenue per customer rather than total spend figures. This keeps your metrics consistent with your business outcomes.
Take the example of Kevin Shahnazar, CEO of FinlyWealth.com, who refined his credit card comparison platform in Canada. By recognizing that only 20% of the 30 million Canadian cardholders actively searched for new cards, he calculated a realistic Serviceable Obtainable Market (SOM) of 1.5 million users – based on his revenue model, not total cardholder spending [9][10].
Confusing TAM, SAM, and SOM in Your Pitch
Mixing up TAM, SAM, and SOM during an investor pitch is a common mistake. Here’s a quick refresher:
- TAM: The total revenue opportunity if you captured 100% of the market.
- SAM: The segment of the market you can realistically reach, given your business model and geography.
- SOM: The portion of SAM you can likely secure in the near term, considering competition and sales capacity [1][8].
When presenting these figures, be explicit about which metric you’re referencing and explain how you calculated it. A Series A venture capitalist emphasized:
“A bottom-up build of future revenue is more useful than basing SOM on a hypothetical % share of TAM or SAM” [7].
Clearly label your numbers, document all assumptions, and never present your SOM as if it were your TAM. This transparency will strengthen your case and build trust with investors.
How to Apply This to Your Business
To effectively use this framework in your business analysis, start by referencing a reliable macro market figure from trusted sources like Gartner or the US Census Bureau [12]. From there, work through the outlined funnel: define the boundaries of your category, segment your market using firmographics or geography, narrow it down to eligible buyers, apply reasonable adoption rates, calculate revenue based on your pricing model, and document every assumption and source along the way [11].
“It is better to be broadly right than precisely wrong.”
Conduct sensitivity testing to validate your estimates [11]. If a single ratio shifts your final number by more than 10%, it’s a sign that this variable requires deeper research [3]. This method ensures your market sizing process is both thorough and easy to audit.
Always cross-check your top-down estimate with a bottom-up calculation. If the two results are within 15% of each other, you can feel confident in the accuracy of your estimate [3]. Significant discrepancies, however, signal a need to revisit your filters and adoption rates. Keep in mind that most tech companies at IPO have captured only 0.1% to 2% of their stated TAM [7]. Instead of inflating your TAM, focus on clearly explaining the logic behind your SOM to investors.
Organize your model for transparency with separate sections for inputs, cascade logic, sensitivity testing, and a source log that includes hyperlinks to every data point [3]. This structure not only simplifies updates but also ensures your model remains adaptable as market conditions change.
Regularly refine your estimates and be ready to justify every filter and assumption. By concentrating on realistic SOM calculations and maintaining clear, well-documented assumptions, you’ll align with investor expectations and build credibility [13].
FAQs
How do I select the right starting point for TAM in top-down market sizing?
To calculate the Total Addressable Market (TAM) accurately, start with a comprehensive and trustworthy metric that reflects the full revenue potential within your product’s category. This might include metrics like total industry sales, global expenditure, or even a related GDP figure. It’s crucial to pull this data from reliable and up-to-date sources, such as industry reports, government databases, or well-regarded market research studies.
Be sure that your chosen metric aligns closely with the boundaries of the category you’ve defined. Additionally, always document your sources clearly to ensure your analysis remains both transparent and precise.
What mistakes should you avoid when defining SAM and SOM?
When refining your TAM (Total Addressable Market) into SAM (Serviceable Available Market) and SOM (Serviceable Obtainable Market), there are several pitfalls that can lead to misleading estimates:
- Overestimating your audience: Including all TAM customers in your SAM without factoring in constraints like geography, product compatibility, or distribution can inflate your numbers unrealistically.
- Overlapping market segments: Double-counting industries or regions can artificially boost figures. Make sure each segment is clearly defined and mutually exclusive.
- Inconsistent data units: Mixing revenue and spend figures in your calculations can skew your results. Stick to a single unit across all metrics.
- Confusing TAM, SAM, and SOM: Mislabeling these metrics – such as presenting TAM as SOM – can lead to misunderstandings with stakeholders. Be precise and transparent in your definitions.
- Small errors, big impact: Even minor miscalculations or flawed assumptions can snowball, distorting your SOM significantly.
To avoid these errors, take the time to clearly define your market segments, use consistent and accurate data, and double-check your assumptions. This ensures your SAM and SOM estimates are reliable and trustworthy.
Why should you use both top-down and bottom-up methods for market sizing?
Using a mix of top-down and bottom-up market sizing methods can give you a more well-rounded and accurate estimate. The top-down approach works by starting with broad market data and refining it through segmentation and adoption rates. This method is especially useful in early-stage planning or when you only have access to general industry figures. Meanwhile, the bottom-up approach takes a more detailed route, building estimates based on specifics like your product’s price, unit sales, and the number of potential buyers you can realistically reach.
Combining these two methods allows you to cross-check for errors, validate any assumptions, and strike a balance between speed and accuracy. This dual approach ensures you’re capturing both the big-picture market trends and the finer details of buyer behavior, resulting in a more dependable market size estimate.


