

The hard truth? A product’s success isn’t just about what it can do – it’s about what users think it will do for them, how fast, and how easily. If users don’t immediately see the value, they disengage – even if the product is technically solid. This disconnect, called the "perceived value gap", often explains why adoption stalls despite strong features.
Here’s the key takeaway: Perceived value drives adoption, not delivered value. Users need quick wins, clear outcomes, and confidence in the product’s promises. If their first experience feels confusing or effort-heavy, they’ll churn quietly. The solution? A simple framework to align expectations, reduce friction, and deliver results fast.
What does this look like in practice?
- Start with clear promises that set realistic expectations.
- Focus on quick, meaningful wins during onboarding.
- Use tools like templates, defaults, and pre-filled data to reduce effort.
- Build feedback loops that reinforce value and encourage habits.
For example, Citrix boosted trial conversions by 28% by guiding users to high-value features during onboarding – without changing the product itself. Similarly, simplifying signup forms and emphasizing outcomes over features increased trial starts by 28% for another SaaS company.
This article breaks down the "Perceived Value System Model" into four components – Inputs, Mechanisms, Outputs, and Feedback Loops – to help you pinpoint and fix adoption bottlenecks. If your product isn’t sticking, it’s likely not a feature problem – it’s a perception problem. Let’s fix that.
Differentiation of Features Vs Customers’ Perceived Value
sbb-itb-e8c8399
The Perceived Value System Model
The Perceived Value System Model: 4 Components for Product Adoption
Many teams mistakenly think of adoption as a straightforward, linear process. However, when one part of the experience falters, the entire perceived value of a product can crumble – regardless of its actual capabilities.
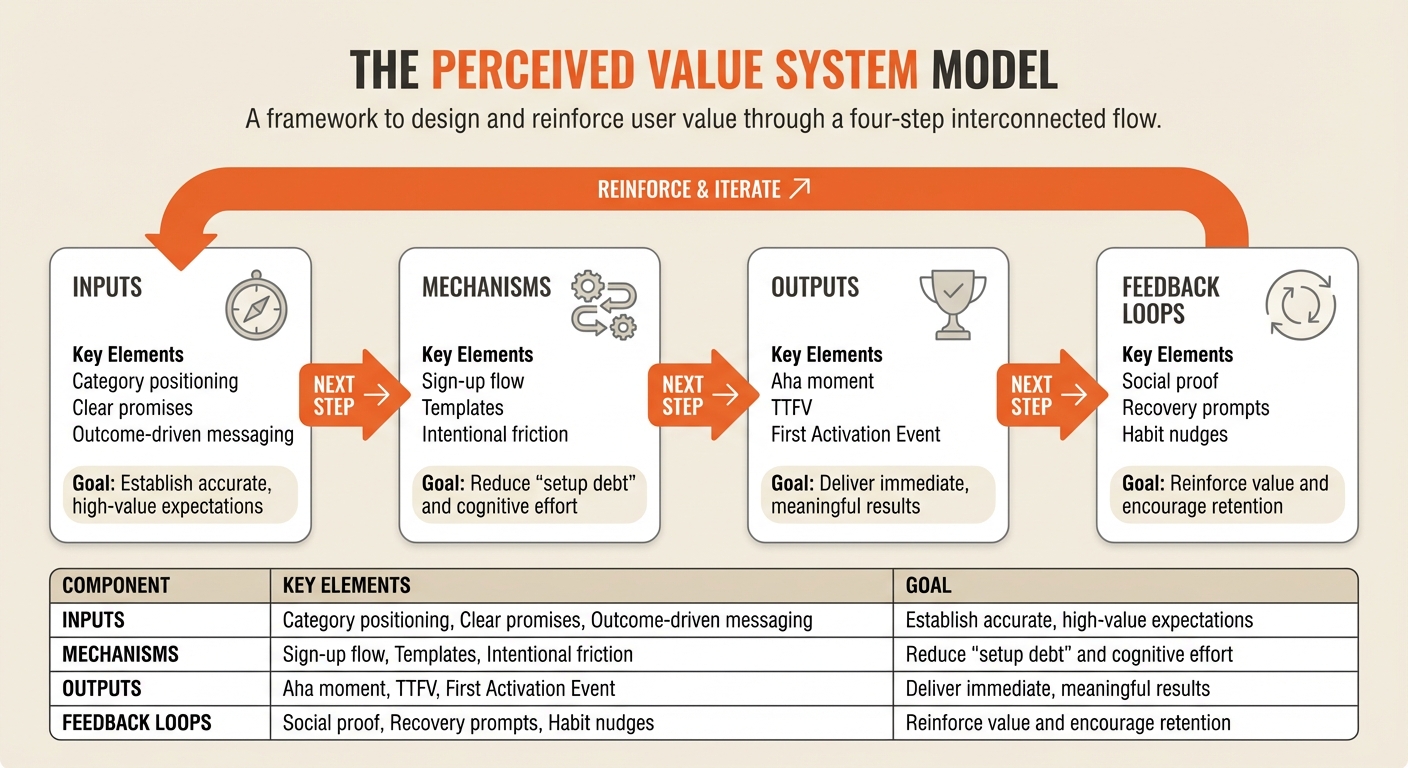
The Perceived Value System Model breaks perceived value into four interconnected components that influence user commitment. Inputs shape user expectations before they even interact with the product, relying on factors like category positioning, clear promises, and outcome-focused messaging. Mechanisms cover the journey from sign-up to the first meaningful success. Outputs represent the tangible results, such as how quickly users achieve their first meaningful win and the confidence they gain from it. Finally, feedback loops either strengthen or weaken the experience through elements like social proof, habit reinforcement, and recovery methods for when users encounter obstacles.
These components follow a specific sequence. Inputs establish expectations, mechanisms either meet or disappoint those expectations by reducing effort, outputs confirm the product’s worth through emotional validation, and feedback loops transform one-time wins into ongoing engagement. When marketing overpromises and the initial experience underdelivers, users quickly disengage [6]. Similarly, if the setup process feels too taxing before delivering value – what’s often called "setup debt" – users quit before they reach the critical "Aha moment" [7].
This model helps bridge the gap between the value a product delivers and the value users perceive, giving teams a framework to design for consistent adoption.
The 4 Components of the Perceived Value System
Inputs lay the groundwork for user expectations. They include category positioning – how the product compares to familiar alternatives – and the clarity of its promise. Effective messaging prioritizes outcomes, clearly communicating the transformation users can expect ("what I’ll get") before detailing the steps required ("what I must do") [2].
Mechanisms guide users from sign-up to their first meaningful success. This phase distinguishes between "intentional friction", like asking users to select roles to personalize their experience, and "accidental friction", such as overly complex forms or unnecessary fields that only benefit the company’s database [6]. To streamline this stage, use defaults, templates, and pre-filled data to eliminate blank states [6][7].
"Onboarding completion is an input metric. It measures effort. Activation is an outcome metric. It measures value delivery." – Jake McMahon, Product Growth & Analytics [7]
Outputs validate the user’s expectations with quick, meaningful results. Metrics like Time-to-First-Value (TTFV) and the First Activation Event (FAE) – a specific action that predicts long-term retention – are critical here [7][4]. The focus shouldn’t be on adding features but on reducing the time it takes for users to achieve their first success.
Feedback loops keep users engaged after their initial win. Social proof, such as testimonials or recognizable logos, builds trust. Recovery prompts help users who hit roadblocks, while contextual tips and ongoing education encourage users to shift from one-time wins to consistent habits [6][7][2]. When these loops are weak, users may experience value once but fail to return.
Here’s a quick summary of the model’s components to help identify bottlenecks:
| Component | Key Elements | Goal |
|---|---|---|
| Inputs | Category positioning, clear promises, outcome-driven messaging | Establish accurate, high-value expectations |
| Mechanisms | Sign-up flow, templates, intentional friction | Reduce "setup debt" and cognitive effort |
| Outputs | Aha moment, TTFV, First Activation Event | Deliver immediate, meaningful results |
| Feedback Loops | Social proof, recovery prompts, habit nudges | Reinforce value and encourage retention |
How to Map the System and Find Bottlenecks
Once you understand the components, the next step is to map out your system and identify where users drop off.
Start by listing every step from the first session to the first meaningful win. Then apply the "delete, delay, or default" rule: eliminate unnecessary steps, postpone non-critical requests (like inviting teammates) until after users experience value, and pre-fill as many settings as possible [6][7].
The most informative metric here is TTFV distribution – not just the average, but the median, 75th, and 90th percentiles. A wide gap between the median and 90th percentile often signals a "tail of stuck users", caused by specific bottlenecks [7]. For products with lengthy setup times, like compliance-focused SaaS, offering "proxy value" within 24 hours – such as sample data or sandbox modes – can help maintain momentum during integration [7].
To find the First Activation Event, compare retained and non-retained user groups. Look for behaviors that are significantly more common among retained users (e.g., inviting a teammate versus exporting a report) [7]. This analysis pinpoints the action most predictive of long-term engagement, helping you fine-tune guidance around it.
Breakdowns in the system tend to occur at predictable points. Inputs fail when marketing oversells the product [6]. Mechanisms fail when users encounter tasks (like settings or tooltips) that don’t immediately deliver value [7]. Outputs fail when dashboards feel empty or lack clear direction [4]. Feedback loops fail when prompts for upgrades or invites arrive before users feel confident in the product [7]. By mapping these components, you can identify the stage causing the biggest drop-off and make targeted adjustments to improve adoption.
Using Positioning to Close the Perceived Value Gap
What Positioning Means for Product Teams
Refining your positioning is a key step in closing the gap between what your product delivers and how users perceive its value. Positioning isn’t just a marketing tool you use once and forget – it’s the lens through which your product is understood. It defines how users compare your product to alternatives, clarifies the specific problem it solves, and even communicates what it doesn’t aim to do. When done well, positioning sets clear expectations for users before they even sign up, which narrows the gap between what they experience and what they anticipated.
Some teams mistakenly reduce positioning to catchy taglines or website copy. In reality, it influences the entire initial user experience by addressing critical questions: Who is this product for? What changes will it bring about? How soon will those changes happen? And what evidence supports its claims? If the promises made during acquisition don’t align with the product experience, users are more likely to abandon it.
The best positioning focuses on outcomes. Instead of leading with features or tasks, emphasize the transformation users can expect, then explain what they need to do to achieve it. Take Miro, for example. During its signup process, Miro uses the Jobs to be Done framework to ask users about their specific goals – like project management, design, or engineering. This personalized approach, combined with pre-built templates, helps users achieve meaningful results quickly [8].
Strong positioning also incorporates elements that reduce perceived risk, such as transparent pricing, free trials, guarantees, and social proof. These features lower the mental barriers to starting, giving users more confidence to invest their time in setting up the product.
Once this foundation is in place, positioning can be used to actively address adoption challenges.
How Positioning Reduces Adoption Barriers
A well-executed positioning framework can address two major adoption hurdles: hesitation about setup and uncertainty around outcomes. Setup hesitation occurs when users doubt whether the effort required will deliver the promised benefits. Similarly, unclear outcomes leave users unsure of what success looks like or how to achieve it.
Google’s early success offers a great example of positioning in action. At a time when Yahoo filled its homepage with an overwhelming mix of news, games, and services, Google’s minimalist search bar delivered an immediate and focused "Aha moment." By respecting users’ time and offering a clear, fast path to value, Google captured 85% of the search market by 2004 [4]. In this case, positioning wasn’t just external messaging – it shaped the entire product experience.
Another example highlights how aligning positioning with user behavior analytics can significantly improve trial conversions. To ease setup hesitation, consider using opinionated defaults like templates, pre-filled settings, or sample data that reflect real-world scenarios. These features make the product feel ready to use from the start, avoiding the frustration of starting from scratch. Additionally, crafting your positioning around the "Aha moment" ensures that users experience a meaningful win as quickly as possible [4].
"Time, not money, is the most precious commodity. When we understand what users want, what they need, and how much time they’re willing to spend, we build better products."
Positioning also plays a role in preventing misuse. When users try to apply a product to tasks it wasn’t designed for, it can lead to frustration and support issues. By clearly stating what your product does – and doesn’t do – you can filter out users who aren’t a good fit before they even sign up. This not only reduces support costs but also improves retention by focusing on the right audience. Ultimately, clarity in positioning is as much a product decision as it is a marketing one.
How to Diagnose and Prioritize Adoption Bottlenecks
The Bottleneck Rule: Fix the Biggest Drop-Off Point First
Once you’ve fine-tuned your positioning strategy, the next challenge is figuring out where users are getting stuck in their journey toward realizing your product’s value. The common mistake? Trying to fix everything at once – whether it’s tweaking onboarding flows or clarifying messaging. This scattered approach often yields little progress. Instead, the bottleneck rule encourages you to focus on the single stage where users lose the most perceived value and address that first.
To identify this bottleneck, track user behavior across four critical stages of the perceived value system: Expectation (what users believe before they sign up), First Contact (their initial experience with the product), First Win (when they achieve a meaningful outcome), and Repeat Value (when they see ongoing benefits). Compare the actions of users who stick around with those who drop off. If retained users consistently complete a specific action, chances are that stage is a high-impact bottleneck [7].
Take Citrix as an example. In 2026, they used product analytics to study trial usage patterns and found that users who interacted with certain features during their trial were far more likely to convert. By redesigning their onboarding to guide users toward these high-value features, they boosted trial conversion rates by 28% [1].
The key is to focus on outcome metrics – ensuring users experience real value – rather than obsessing over setup tasks. Teams that prioritize onboarding chores over delivering value often see activation rates stagnate between 20% and 35% [7]. If users feel like they’re doing work without seeing benefits, they’re likely to churn.
Once you’ve identified where users are dropping off, a structured scoring method can help you decide which bottleneck to tackle first.
A Simple Scoring Method for Prioritization
After mapping out potential bottlenecks, use a straightforward scoring framework to determine where to focus your efforts. Evaluate each bottleneck across four criteria, scoring on a scale of 1 to 5:
| Criteria | Scoring Logic (1-5) | Why It Matters |
|---|---|---|
| Frequency of Failure | 1 = Rare; 5 = Affects >50% of users | Highlights where the largest number of users is lost. |
| Severity of Impact | 1 = Low correlation to churn; 5 = High correlation | Identifies bottlenecks critical to retention. |
| Fixability (Speed) | 1 = >3 sprints; 5 = Can fix in 1–2 sprints | Helps prioritize quick wins, like eliminating unnecessary steps. |
| Cross-Functional Leverage | 1 = Limited to product; 5 = Impacts multiple teams (Sales/Marketing/CS) | Ensures the fix benefits multiple departments. |
The bottleneck with the highest total score becomes your priority. For example, a bottleneck affecting 60% of users that can be resolved in one sprint should take precedence over one impacting only 10% of users but requiring three months of engineering work.
To streamline the process, apply the "Delete, Delay, or Default" rule. If a setup step doesn’t directly lead to the first activation event, eliminate it, delay it until users have experienced value, or offer a smart default option. LogMeIn used this approach to restructure its activation process, ultimately increasing its break-even advertising budget on Google Ads by 50×. This contributed significantly to its $4.3 billion acquisition [3].
Example: Fixing Adoption for a Workflow Product
Identifying the Problem
A project management SaaS company was offering real benefits – automating task assignments, tracking dependencies, and generating progress reports – but they were struggling to keep new users engaged. Only 22% of trial users reached activation, which the company defined as creating their first automated workflow. The problem was clear: users signed up with high expectations but abandoned the product before they could see any meaningful results.
The team identified four key bottlenecks: the marketing promise was too broad ("automate your entire workflow"), the setup process was overwhelming (integrations, team invites, and permissions), there was no clear guidance, which left users unsure of their next steps, and the product’s value wasn’t demonstrated quickly enough. With these issues mapped out, the team set out to simplify and refocus the user experience.
Changes That Closed the Gap
The team tackled each bottleneck using targeted adjustments based on the perceived value system model. First, they refined the initial promise from "automate your workflow" to "create your first automated task in under 5 minutes." This new goal was specific, achievable, and tied directly to an immediate reward. Next, they replaced confusing empty states with three pre-built workflow templates (sprint planning, bug triage, and content approval) preloaded with sample data. This allowed users to see the product in action from the very beginning.
They also moved friction points to later in the process. The team invite prompt was removed from the signup flow, and integration setup was postponed until after users had successfully created their first personal workflow. Finally, they provided clear in-product proof of value by showcasing before-and-after examples that demonstrated how a template could reduce manual work from 45 minutes to just 3 minutes.
The results were immediate and striking: activation rates increased from 22% to 41% in just two months, and support tickets related to "I don’t know where to start" dropped by 63%. These changes not only doubled activation rates but also gave the team a reliable method for diagnosing and improving other stages of the user journey. By aligning their promises with quick, tangible results, they created a more engaging and effective onboarding experience.
Perceived Value Gap Audit: 10-Question Checklist
This checklist is designed to help you pinpoint where your product’s perceived value might falter. By addressing these questions, you can identify weaknesses across four key stages: inputs (what users expect), mechanisms (first interactions), outputs (initial success), and feedback loops (long-term engagement). Be honest in your answers and focus on the stage with the most "no" responses. This tool works alongside the Perceived Value System Model to reveal specific problem areas.
Can a new user explain what your product does in one sentence after 10 seconds? (Inputs)
Your product’s purpose and relevance should be immediately clear. If users can’t summarize it quickly, your value proposition might be too complicated or vague.
Is your first promise narrow enough to be believable? (Inputs)
Avoid broad claims like "automate your entire workflow", which can sound unrealistic. Instead, focus on clear, achievable outcomes. For example, Notion shifted from listing features like "notes, docs, and databases" to emphasizing results: "You assign the task. Your agent does the work", helping users picture success right away [2][5].
Do you show proof before asking for effort? (Mechanisms)
Early interfaces should display sample data or templates to validate your product’s promise immediately [6][7]. For instance, Citrix boosted trial conversions by 28% by steering users toward features linked to long-term retention [1].
Is there a single guided path to the first meaningful outcome? (Mechanisms)
Tools like Miro streamline the onboarding process by asking users about their specific roles during signup and then offering tailored templates to accelerate progress [8].
Do users see measurable progress within five minutes, avoiding the need for an extensive tutorial? (Outputs)
As Kate Syuma of Growthmates notes, products often lose users because "nothing meaningful happens early enough" [5]. Quick wins are key to keeping users engaged.
Is the first win tied to a real job-to-be-done rather than a generic demo? (Outputs)
Users want to experience actual value, not just read about it or complete a demo task [9].
Do you mitigate decision anxiety by clearly defining what the product is and isn’t meant to do? (Inputs)
Set accurate expectations upfront to avoid mismatches that could lead to churn.
Do you remove unnecessary early choices using defaults, templates, or pre-sets? (Mechanisms)
Simplifying early decisions helps users maintain momentum during their initial experience.
Does the product reinforce its core mental model through concise microcopy and timely nudges? (Feedback Loops)
Subtle, well-timed guidance helps users naturally adopt and understand the product’s system.
Do support tickets and drop-off points clearly map to a specific stage in your system? (Feedback Loops)
For example, if refining your onboarding reduces "I don’t know where to start" queries, you’ve likely tackled a critical bottleneck effectively.
Conclusion: Design Perceived Value Like Any Other Product System
Adoption doesn’t just happen – it’s the result of a well-thought-out system where users move seamlessly from clear expectations to their first success and beyond. When teams approach perceived value as an integral product system rather than a secondary marketing concern, they gain a practical framework to diagnose why users leave, where they encounter friction, and what targeted changes can make a real difference.
The Perceived Value System Model equips product teams, designers, and customer success teams with a shared vocabulary. Instead of debating whether the issue lies in "messaging", "onboarding", or "the product itself", this model helps pinpoint the exact stage where perceived value breaks down. From there, teams can implement small, focused changes that deliver the biggest impact. As Andrea López from Product People explains:
"Designing for seamless adoption is about more than ‘a nice onboarding flow.’ It’s about shaping the first minutes, hours, and days of the user journey so the product does the selling for you: clear value, low friction, no confusion, and a path that feels obvious" [6].
This approach offers a practical way to close the gap between user expectations and their actual experience. Start by running the Perceived Value Gap Audit on a high-traffic onboarding flow this week – evaluate each stage, identify the biggest drop-off, and make one change that enhances clarity, speeds up the first win, or builds trust. The most successful teams aren’t the ones with endless features – they’re the ones who earn user confidence early and make the journey to value unmistakably clear.
FAQs
How do I measure perceived value in my product?
To gauge perceived value, assess how effectively users grasp the product’s benefits and potential outcomes before they commit their time or effort. Prioritize minimizing both risk and friction in their journey. Keep an eye on metrics like time-to-first-value or the moment users experience their first "Aha!" realization. Dive into user feedback and behavior patterns to pinpoint areas where clarity, trust, or speed to value may fall short.
What’s the fastest way to find our activation bottleneck?
To address where perceived value falls apart for users, start by mapping out the entire user journey. Pinpoint the exact stage where frustration peaks or drop-off rates are the highest. A Perceived Value Gap Audit can help here by asking key questions: Are users experiencing progress quickly? Is the initial promise both clear and believable? Is the guidance provided at this stage helpful and actionable? Concentrate your efforts on the point where users lose trust or disengage.
How do I choose the right First Activation Event?
Choosing the right First Activation Event is key to helping users experience value quickly and reach their "aha" moment. Look for a specific action or milestone that signals real progress – like finishing a setup process or completing a key task. Make sure it’s straightforward, easy to achieve, and aligned with the user’s main goal. This reduces friction, speeds up time-to-value, and encourages adoption.


