

Here’s what might surprise you: The average B2B marketing budget is growing, but just spending more isn’t enough to drive results. By 2026, 69% of marketers expect budget increases, with spending rising from 9% to 10% of revenue. Yet, success hinges on how you allocate those dollars. This guide breaks down benchmarks, templates, and tools to help you make every dollar count.
Key Takeaways:
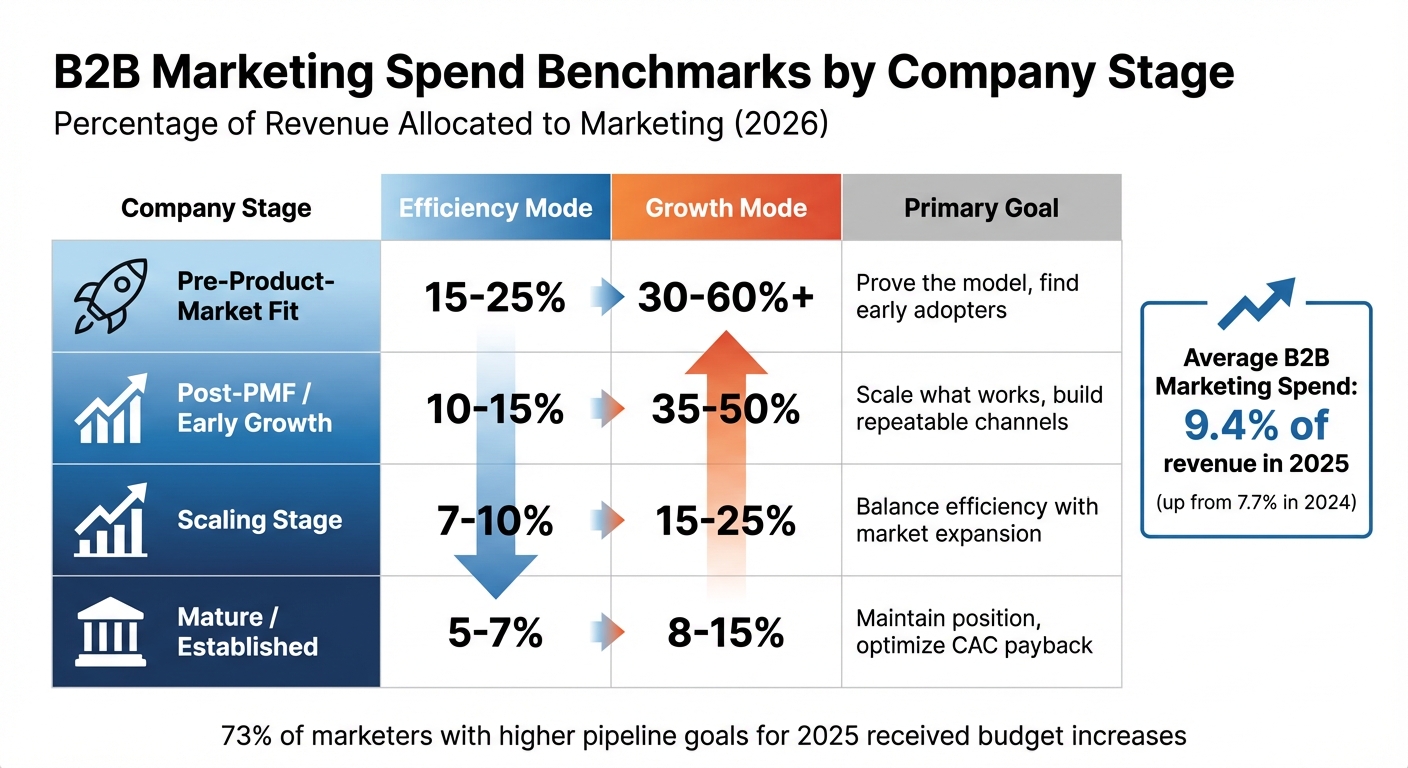
- Average Marketing Spend: 9.4% of revenue in 2025, up from 7.7% in 2024.
- By Company Stage:
- Pre-PMF: 30–60% of revenue focused on testing and awareness.
- Scaling Stage: 15–25% for balancing growth and efficiency.
- Mature Companies: 5–7%, prioritizing optimization.
- GTM Motion Impacts:
- PLG firms spend 13% of revenue, with higher tech/tool investments.
- SLG averages 9%, balancing programs and personnel.
- ABM hybrid models invest heavily in personalization and account tools.
- Budget Allocation:
- Personnel: 30–40%
- Paid Demand: 18–42%
- Content/Brand: 14–16%
- Tools/Data: 12–17%
- How to Plan: Tie budgets to revenue goals, CAC, and LTV. Use the 70/20/10 rule – 70% on proven strategies, 20% on emerging channels, 10% on experiments.
The hard part is this: Aligning your budget with your growth stage, GTM strategy, and revenue goals. This guide gives you the tools to do just that – whether you’re pre-revenue or scaling past $100M.
B2B SaaS marketing budget planning & allocation guide
sbb-itb-e8c8399
B2B Marketing Spend Benchmarks: Quick Reference
B2B Marketing Budget Allocation by Company Stage 2026
Spend Ranges by Stage and Growth Mode
In 2025, B2B companies are allocating an average of 9.4% of their revenue to marketing, a noticeable increase from 7.7% in 2024 [8]. But this figure is just a baseline. The actual percentage varies significantly depending on a company’s stage and growth ambitions.
For instance, early-stage B2B SaaS companies often dedicate 20–30% of their revenue to marketing. In contrast, mature firms operating in efficiency mode typically spend only 5–7%, prioritizing the refinement of existing channels rather than aggressive market expansion [6].
Here’s a breakdown of marketing spend ranges by company stage and growth mode:
| Company Stage | Efficiency Mode (% of Revenue) | Growth Mode (% of Revenue) | Typical Goal |
|---|---|---|---|
| Pre-Product-Market Fit | 15–25% | 30–60%+ | Prove the model, find early adopters |
| Post-PMF / Early Growth | 10–15% | 35–50% | Scale what works, build repeatable channels |
| Scaling Stage | 7–10% | 15–25% | Balance efficiency with market expansion |
| Mature / Established | 5–7% | 8–15% | Maintain position, optimize CAC payback |
These percentages reflect how strategies evolve as companies mature, shifting from early-stage validation efforts to fine-tuning in established markets. Companies aiming for aggressive growth naturally allocate more resources than those focusing on profitability. Supporting this, 73% of marketers tasked with higher pipeline goals for 2025 also received budget increases to help achieve them [9].
Now, let’s clarify what actually counts as marketing spend within these benchmarks.
What Counts as Marketing Spend
For benchmarks to be meaningful, a consistent definition of marketing spend is essential. Without clear boundaries, comparisons lose their value.
Here’s what should be included in marketing spend calculations: personnel costs (salaries, benefits, bonuses), external agencies, contractors, marketing technology, paid media, content creation, events, website optimization, and analytics tools [6] [2] [7].
Personnel typically accounts for the largest share – about 45–55% of the budget. Technology and tools make up 15–30%, while paid media averages 30.6% [8].
However, certain expenses are excluded from these benchmarks, such as costs related to Sales, RevOps, Customer Success, and product-led onboarding [6].
“The standard range is 7–12% of projected revenue. But let me be clear about something that frustrates me: treating this as gospel is a mistake.” – Stefano Mandola [6]
Up next, we’ll dive deeper into how a company’s stage and go-to-market strategy shape these spending benchmarks.
Spend Benchmarks by Company Stage and GTM Motion
Pre-PMF, Post-PMF, and Scaling Stages
The stage of your company’s growth plays a crucial role in determining how much to allocate to marketing. For companies in the pre-product-market fit (Pre-PMF) phase, marketing budgets often range from 30–60%+ of revenue. At this stage, the focus is on building awareness, testing messaging, identifying effective channels, and forming initial customer relationships.
Once product-market fit (PMF) is achieved – usually around $1M–$5M ARR – companies tend to shift their strategy. Post-PMF firms allocate 35–50% of revenue, moving from experimentation to scaling proven tactics like content marketing, SEO, and paid campaigns.
As revenue grows beyond $5M, marketing spend as a percentage of revenue generally decreases. Companies in the scaling stage typically allocate 15–25% of revenue to marketing efforts. For highly mature businesses – those surpassing $150M in revenue – this figure may drop to as low as 4%.
These shifts are tied to different priorities. Early-stage companies are more likely to accept longer customer acquisition payback periods and higher cost multipliers to gain market share. In contrast, mature firms prioritize efficiency, focusing on shorter payback periods and more predictable unit economics. These dynamics are essential when evaluating marketing budgets across various go-to-market (GTM) models.
How GTM Motion Affects Spend: PLG, SLG, and ABM-Hybrid
Beyond company stage, your GTM motion – whether Product-Led Growth (PLG), Sales-Led Growth (SLG), or an Account-Based Marketing (ABM) hybrid – further refines how marketing budgets are allocated.
For PLG companies, marketing often takes on responsibilities traditionally handled by sales, such as onboarding users and driving in-product engagement. As a result, PLG companies typically spend a median of 13% of revenue on marketing, compared to 9% for SLG and 10% for hybrid models [5][11].
This difference is also reflected in how budgets are divided. PLG organizations allocate about 52% of their marketing budget to programs like ads, content, and product marketing, and roughly 32% to personnel. In contrast, SLG companies distribute their spend more evenly, with approximately 44% going to programs and another 44% to staffing [5][11]. Additionally, PLG firms tend to invest more in technology – around 16% of the marketing budget versus 13% for SLG – to support automation and track product-qualified leads [11].
For ABM-hybrid models, which focus on accounts with annual contract values (ACVs) exceeding $25,000, personalization and account intelligence tools are critical. These strategies demand significant coordination between sales and marketing teams. The investment often pays off: top B2B marketers report an 81% higher ROI with ABM, and companies integrating ABM with Account-Based Advertising see 60% higher win rates [10].
The timing of campaign results also varies by GTM motion. PLG companies benefit from rapid feedback loops, where users quickly convert or churn. This dynamic pushes PLG firms to optimize activation rates, with top performers achieving rates above 65% [10]. On the other hand, SLG and ABM models operate on longer sales cycles, relying on sustained nurture campaigns and field marketing. These strategies take more time to deliver results, so aligning your budget with your conversion timeline is key. Avoid copying tactics from models that don’t match your business dynamics.
How B2B Companies Allocate Marketing Budgets
The 4 Budget Categories Explained
B2B marketing budgets typically fall into four main categories: personnel, paid demand, content/brand, and tools/data. Knowing how these categories are usually divided can help you evaluate your own spending and spot any gaps.
- Personnel: This includes internal salaries, benefits, and agency fees, making up 30–40% of the total marketing budget [1][5]. The range reflects whether companies rely more on in-house teams or outsourced agencies to handle their marketing efforts.
- Paid demand: Covering search ads, social media advertising, display campaigns, and video, this category accounts for 18–42% of budgets [1][3]. Startups often dedicate 35–45% to paid media for quick pipeline growth, while larger enterprises lean toward 20–30%, focusing on more sustainable channels [8].
- Content and brand: Around 14–16% of the budget goes toward content creation, SEO, PR, and social media [1][4]. This allocation reflects the importance of maintaining a strong brand presence, especially in a world increasingly shaped by AI-driven filters.
- Tools and data: Spending on martech and analytics tools, like CRM systems, marketing automation platforms, and AI tools, typically represents 12–17% of the budget [1][5]. This area is growing fast – by 2025, 23% of companies plan to allocate 16–20% of their marketing budget to AI tools, up from 11% in 2024 [5].
While these splits provide a useful benchmark, they can differ significantly depending on the industry and a company’s specific needs.
How Allocations Vary by Industry
Industries shape budget allocations in unique ways, driven by factors like buyer behavior, sales cycles, and compliance requirements. Here’s how some key industries approach their marketing budgets:
- Technology and software: These companies typically allocate 9.16–15% of revenue to marketing [1][2], with a strong focus on digital channels. Paid search takes up 13.9%, and account-based marketing accounts for 16% of their budgets [1]. More than 56% of their spend goes toward online strategies [2].
- Financial services: Marketing budgets here range from 7.2–11.18% of revenue [1]. Spending is split between traditional channels (13%) and digital (17%), with a focus on compliance-heavy content and building trust [1].
- Healthcare: With budgets representing 5.9–9.31% of revenue [1], healthcare companies prioritize in-person engagement and thought leadership. Events and conferences take up 14% of spending, while public relations accounts for 13% [1].
Channel preferences also vary widely. Tech companies lean heavily on search and social advertising, financial services balance digital with traditional media, and healthcare relies on events and PR to connect with cautious decision-makers. These differences highlight how industries adapt their strategies to suit their unique challenges and opportunities.
3 Budget Allocation Templates to Start With
Here are three practical budget templates designed to help you allocate marketing dollars effectively, tailored to different growth stages. These templates build on spending benchmarks and allocation strategies, making it easier to align your budget with your company’s current needs.
Early-Stage Lean Budget
For companies in the pre-revenue stage or with less than $2M ARR, it’s all about focusing on channels that deliver long-term value without overspending. Here’s how to allocate your budget:
- 20–40%: Content marketing for thought leadership and organic lead generation.
- 10–20% each: Paid channels (for immediate traction), PR/awareness (to build credibility), and website optimization (to improve conversions).
- 10–15%: Email marketing and nurturing to maintain engagement.
- 4–6%: Tools and technology to support your efforts[7][3].
“Startups can’t afford to waste budget on ‘brand awareness’ that doesn’t convert. Be ruthless about ROI.”
- Stefano Mandola, Digital Marketing Manager [6]
Set aside a portion of your budget for testing new growth opportunities, but avoid cutting investments in SEO or community building. These channels take 1.5 to 3 years to mature and can become expensive to reestablish later. If your company is ready to push for faster pipeline growth, consider the next budget strategy.
Pipeline Push Budget
For companies generating $5M–$20M ARR, the focus shifts to rapid pipeline generation and direct response. Allocate your funds as follows:
- 60–80%: High-intent channels like paid search and LinkedIn, which drive immediate results.
- 10–20%: Brand building through thought leadership and PR to enhance visibility.
- 10–20%: Lead nurturing to ensure prospects don’t drop off before converting[14][6].
“Pulling back [on prospecting] now creates a Q2/Q3 pipeline air pocket you’ll feel six months from now.”
Leverage AI to automate repetitive tasks like data entry and email sequencing, allowing your team to scale output without adding headcount[12][14]. Use a bottom-up approach to budgeting, factoring in revenue, CAC, and ACV for precision with a KPI scorecard and pipeline tracker[6]. For companies operating at a larger scale, the focus moves toward establishing market authority.
Enterprise Brand and Field Marketing Budget
For companies with over $100M in revenue, the priority becomes building market authority. Following benchmarks for scaling organizations, allocate your budget as follows:
- 60–70%: Demand generation, including new lead acquisition, paid campaigns, and pipeline creation.
- 20–30%: Brand building, such as thought leadership, PR, and executive social media.
- 10–20%: Lead nurturing to drive retention, upselling, cross-selling, and advocacy[6].
Within the brand-building category, break down spending further:
- 20.7%: Corporate and executive social media, plus influencers.
- 14.4%: PR and related agency costs.
- 14%: Events and conferences[4][1].
“Invest in credibility, recognizability and consistent content performance to win attention and accelerate growth in an AI-filtered landscape.”
Stay flexible by reevaluating and reallocating funds quarterly based on performance rather than sticking to an annual plan[6][2]. Reserve 15–20% of your budget for experimenting with new channels and technologies to maintain a competitive edge in a rapidly evolving digital environment[2].
How to Build Your Budget from the Ground Up
What You Need to Calculate Your Budget
This bottom-up budgeting method ties every dollar to your pipeline’s performance, creating a clear connection between spending and results. Start by gathering the key metrics that will guide your budget. Your annual revenue target acts as your overarching benchmark. From there, use your Average Contract Value (ACV) to figure out how many deals you need to close. Next, collect your conversion rates for each stage of your funnel – from leads to opportunities to closed deals – to determine the volume of leads required at the top of the funnel.
Another critical factor is your Customer Acquisition Cost (CAC), which sets the maximum you can spend to acquire a customer while remaining profitable. Pair this with your Customer Lifetime Value (LTV) to ensure your spending aligns with the long-term value of your customers. For B2B companies, a solid LTV:CAC ratio generally falls between 3:1 and 5:1[6][7].
| Input Metric | Why It Matters for Budgeting |
|---|---|
| Revenue Goal | Guides the total investment needed to hit your targets. |
| Average Contract Value (ACV) | Helps calculate the number of deals required to meet goals. |
| Conversion Rates | Determines the lead volume needed at each funnel stage. |
| Target CAC | Defines the spending limit to acquire a single customer. |
| LTV | Ensures spending is sustainable in relation to customer value. |
Once you’ve gathered these metrics, use unit economics to calculate your marketing spend with precision.
Using Unit Economics to Set Spend Ranges
Start with your revenue target and work backward to calculate the demand volume your marketing efforts must generate. Divide your revenue goal by your ACV to determine the number of customers you need. Then, factor in your close rates and lead conversion rates to calculate the leads required at the top of the funnel[7].
This approach offers a detailed view of the demand your marketing team must create. Compare it with a top-down perspective: most B2B companies allocate around 8% of revenue to marketing[6][3], while high-growth B2B SaaS companies often spend 20–30% in their early stages[6]. Alternatively, some firms use the Growth-Delta Method, dedicating 30–40% of the gap between their current ARR and next year’s target ARR to marketing[7].
“The question moves from ‘how much should we spend on marketing?’ to ‘how much does it cost to find, nurture, and acquire a customer of this value?'” – Show + Tell[14]
Your LTV:CAC ratio serves as a crucial checkpoint. If your ratio is much higher than 3:1, you might be underspending and missing growth opportunities. If it’s below 3:1, focus on improving efficiency before scaling your budget further[6][7].
Once you’ve calculated your demand volume, use the following checklist to fine-tune your budget.
When to Spend More or Less: A Checklist
You should increase your budget in scenarios such as launching a new product or brand, targeting aggressive growth of 100% year-over-year, or when your LTV:CAC ratio indicates room for more acquisition spending[1][6][7]. If you’re in a highly competitive industry and competitors are outspending you by a wide margin, it may also be time to allocate more funds[6].
On the other hand, consider scaling back or optimizing your spending if you’ve already increased your budget but haven’t seen improvements in conversion rates, if your business is in a maintenance phase with an established customer base, or if you lack clear ROI tracking for your current marketing efforts[3][1]. Companies prioritizing profitability over aggressive acquisition – often more mature businesses – tend to spend at the lower end of the range[7].
To keep your strategy flexible, allocate 15–20% of your budget toward testing new channels and technologies[2]. Plan quarterly reviews to adjust spending based on performance rather than sticking rigidly to an annual plan[6][2]. This ensures your marketing efforts stay agile and aligned with your goals.
Conclusion
When planning your B2B marketing budget for 2026, the key isn’t mirroring what others are doing – it’s grounding your strategy in where you stand now and where you aim to go. While many B2B companies allocate 7–12% of their revenue to marketing, early-stage businesses chasing aggressive growth often push that figure to 15–25% or higher[6]. The real challenge is translating these percentages into a budget that aligns with your revenue goals, funnel performance, and overall unit economics.
Begin by using allocation templates that suit your company’s stage and go-to-market (GTM) strategy, then adjust them based on your specific pipeline metrics. Rely on tried-and-tested allocation models and schedule quarterly reviews to stay flexible. These steps tie directly to the frameworks and tools we’ve outlined, helping you ensure your spending drives meaningful growth.
“The companies that win in 2026 won’t be the ones with the biggest budgets. They’ll be the ones who allocate strategically, measure obsessively, and optimize constantly.” – Stefano Mandola[6]
Keep a close eye on your LTV:CAC ratio. If it’s consistently above 3:1, you likely have room to scale your marketing spend. If it’s below that benchmark, focus on improving efficiency before increasing your budget[6][7]. And while 83% of B2B marketing leaders plan to increase their budgets in 2026[2], the real winners will be those who tie every dollar to a measurable result.
FAQs
How should I adjust my B2B marketing budget based on my company’s growth stage?
Your marketing budget should reflect your company’s growth stage, carefully balancing revenue allocation with strategic goals:
- Early-stage (pre-product-market fit): Dedicate 15–20% of revenue to marketing, with 60–80% of that budget focused on demand generation. At this stage, the priority is building a robust pipeline, even if it results in higher customer acquisition costs (CAC) and extended payback periods.
- Scaling stage (post-product-market fit): Adjust marketing spend to 7–12% of revenue, spreading the budget more evenly. Allocate 50–60% to demand generation, 20–30% to brand and content, and 20–30% to tools and data. This ensures continued growth while maintaining healthier CAC and more controlled expenses.
- Mature stage (efficiency-focused): Scale back marketing investment to 5–7% of revenue, prioritizing retention, automation, and brand-building. Distribute funds with 30–40% for brand and partner marketing, 30–40% for tools and data, and 30–40% for demand generation. The focus shifts to efficient pipeline growth and shorter CAC payback periods.
Earlier stages demand a higher percentage of revenue and a strong push for demand generation, while later stages emphasize efficiency, balanced spending, and long-term brand development.
How does budget allocation differ between product-led (PLG) and sales-led (SLG) growth strategies?
PLG companies tend to channel a bigger slice of their marketing budget into product-centered efforts. This includes things like in-product onboarding experiences, tools for self-serve acquisition, and tracking usage analytics. By prioritizing these areas, they can reduce reliance on traditional sales-heavy activities, which often means keeping sales teams smaller and more focused.
On the flip side, SLG companies direct more of their budget toward sales-oriented resources. This often involves funding account executives, outbound campaigns, demo-driven events, and partner programs. Their spending is centered around people (like sales and SDR teams), paid demand generation (ads and outbound campaigns), and event marketing, with less attention given to activating users through product-led methods.
The approach to marketing channels also highlights the difference. PLG companies favor scalable and cost-effective options, such as free trials and in-product content. Meanwhile, SLG companies rely on more personalized, high-touch strategies, including paid media, trade shows, and direct outreach tailored to specific high-value accounts.
How can I make sure my marketing budget supports my revenue goals and maintains a strong LTV:CAC ratio?
To align your marketing budget with your revenue goals while keeping a healthy LTV:CAC ratio, it’s best to start with a bottom-up approach focused on unit economics. Begin by identifying your revenue target, then calculate the pipeline needed to hit that number. For instance, divide your revenue target by your average contract value (ACV) to figure out how many deals you’ll need. Next, apply your historical conversion rates (e.g., lead → MQL → SQL → closed-won) to estimate the volume of demand required at each stage of your funnel.
To maintain a strong LTV:CAC ratio – say, 3:1 or better – determine the maximum CAC you can afford by dividing your customer lifetime value (LTV) by your target ratio. This calculation sets a clear boundary for how much you can spend across your funnel. Adjust your budget depending on your goals: in growth mode, you might prioritize shorter payback periods and higher pipeline coverage, while efficiency mode would call for tighter burn rate controls and more selective spending.
When allocating your budget, focus on four main categories: people, paid demand, content/brand, and tools/data. A common breakdown might look like this: 60-80% for demand generation (e.g., paid ads, SEO), 10-20% for brand-building efforts, and 10-20% for nurturing and technology. Keep an eye on key metrics like CAC payback, pipeline coverage, and LTV:CAC to ensure your spending supports both revenue growth and long-term profitability. If your metrics fall short, shift resources to strategies with higher impact. On the other hand, if performance exceeds expectations, consider reinvesting in growth or other high-margin opportunities.


