
If you want AI marketing reporting to work, start with the KPI tree, fix your attribution, and keep a person reviewing every summary before it goes out. It might surprise you to hear that one-page reports drive action 74% of the time, while long reports get far fewer decisions. At the same time, about 70% of AI-assistant visits can end up in GA4 as Direct, which means a fast-growing channel can disappear from your numbers if you don’t label it correctly.
I’d boil this workflow down to a few moves:
- Pick decision metrics first so your reports answer business questions, not vanity questions
- Tie traffic to CRM and revenue so you can track sessions through leads, pipeline, and closed-won deals
- Set channel rules for AI assistants like ChatGPT, Gemini, Claude, Perplexity, Copilot, Meta AI, and Grok
- Use clean UTMs and a custom AI channel group so source data stays usable
- Run checks before AI writes anything because bad data turns into bad summaries fast
- Automate the order of work: data refresh, KPI math, dashboard update, then AI narrative
- Keep people in the loop for QA, context, and the final call on action
The article’s main point is simple: automation should do the repeat work, while your team handles judgment. In other words, let the system pull data, sort channels, flag shifts, and send reports on schedule. Then let your team review tracking, explain why numbers moved, and decide where to put budget.
A few details matter more than most teams think:
- Set GA4 retention to 14 months so year-over-year views don’t break
- Mark May 13, 2026 as the start of GA4’s native AI Assistant channel grouping
- Keep Unassigned traffic under 5%
- Treat tracking gaps, stale data, or attribution errors as stop-ship issues
- Run the new workflow beside your manual process for 2 to 4 weeks before fully switching
If I were launching this today, I’d start with one short report, one fixed cadence, one KPI structure, and one review step. That gives you a reporting system that’s easier to trust, easier to read, and much more likely to lead to action.
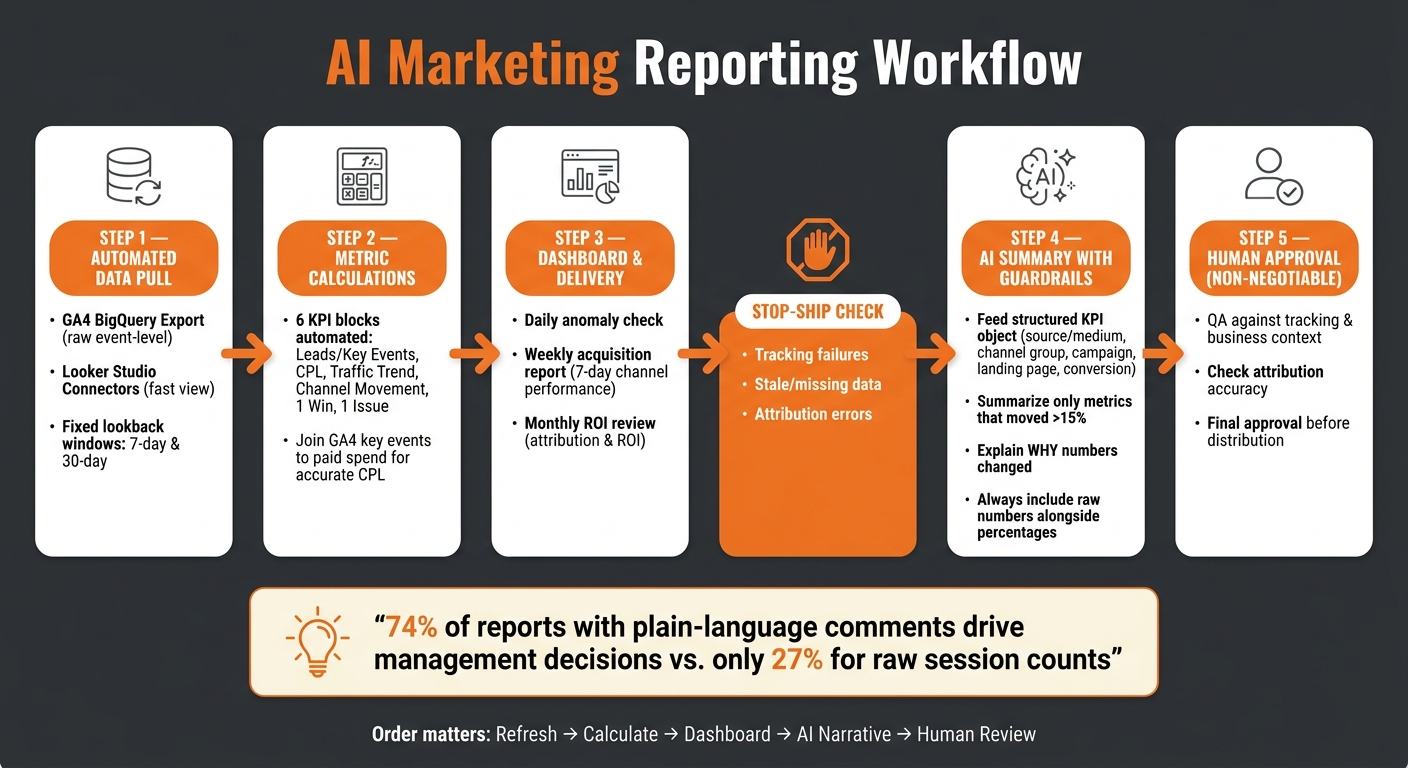
AI Marketing Reporting Workflow: Step-by-Step Automation Process
Automate Your Marketing Reporting With AI
1. Define the Reporting Scope and KPI Tree
Start with the business questions. Then build the dashboard around those questions. That’s what turns a reporting goal into a KPI tree your workflow can automate.
Choose the Core Traffic-Acquisition Metrics and Dimensions
Use context metrics to describe traffic, and use decision metrics to guide action. In practice, your default reporting layer should lean on decision metrics, not vanity metrics.
Your core dimensions should include source/medium, channel group, campaign, landing page, device, and geography. You’ll also want a custom AI channel group. Default channel groups can hide AI referrals inside Direct or Referral, which muddies the picture. Map newer GA4 AI Assistant traffic natively, and normalize older data by hand [7][9][10].
Map Channel KPIs to Pipeline and Revenue
Capture session source/medium in your CRM at the time of form submission. That’s how you tie traffic back to MQLs, SQLs, opportunities, and closed-won revenue [6].
Each metric layer should answer one business question:
| Metric Category | Standardized KPIs | Business Question Answered |
|---|---|---|
| Acquisition | Sessions, Users, New vs. Returning | Which channels are driving traffic? |
| Engagement | Engagement Rate, Avg. Session Duration | Are visitors actually consuming content? |
| Conversion | Key Events (Leads), Conversion Rate | Did traffic produce leads or sales? |
| Outcome | Revenue, Cost Per Lead (CPL), CAC | What is the actual ROI of each channel? |
If your KPI tree is fuzzy, AI summaries will drift toward the data that’s easiest to pull instead of the data the business needs.
Set a clear rule for what counts as a Key Event before you automate anything. Otherwise, non-commercial actions like simple page views or newsletter signups can inflate CPL and skew AI-generated insights [1].
Once traffic connects to revenue, your reporting workflow can rank channels by business impact instead of raw volume.
Set Governance Rules Before You Build
Lock down three things early:
- UTM naming conventions
- Campaign taxonomy
- Attribution consistency across tools
Use lowercase, hyphenated UTM values. A setup like utm_source=chatgpt, utm_medium=ai-assistant, and utm_campaign=ai-discovery helps keep attribution intact when referrers get stripped out, which happens often in mobile app traffic [2][10]. These rules exist to stop broken attribution and messy AI summaries, not to add busywork.
Also, set GA4 data retention to 14 months in Admin settings. The default 2-month setting can wipe out historical Explore data and break year-over-year reporting [3].
With the KPI tree in place, you’re ready to build the data and tracking setup that feeds it.
2. Build the Data and Tracking Foundation
Once your KPI tree is set, build a data feed you can trust. Fix the tracking layer before you automate reports. Start with channel definitions, then connect the rest of the stack.
Set Up GA4 and Campaign Tracking for Traffic Acquisition

GA4 is your capture layer, but the default setup still misses some AI traffic. As of May 13, 2026, GA4 includes a native "AI Assistant" default channel group. It automatically buckets sessions from recognized assistants like ChatGPT, Gemini, and Claude under the medium ai-assistant [4].
That helps, but it doesn’t catch everything. The good news is you can close the gap with custom rules.
Build a regex-based custom channel group and place it above Referral in your channel group priority list [9]. A starter pattern is:
chatgpt\.com|chat\.openai\.com|gemini\.google\.com|perplexity\.ai|claude\.ai|copilot\.microsoft\.com|meta\.ai|grok\.com
For any AI-driven links you control, keep your UTM structure consistent:
- Use
utm_sourcefor the specific platform, such aschatgptorperplexity - Use
utm_medium=ai-assistantso it lines up with GA4’s native grouping - Use
utm_campaignfor the content theme or prompt context [2][4]
Use one lowercase UTM standard across all AI links. It sounds small, but this is the kind of detail that keeps your reports clean six months from now.
Also, annotate May 13, 2026 in GA4 as the start date for native AI Assistant tracking [4]. Without that note, a sharp channel shift can look like a reporting glitch when it’s just a platform change.
Once your source tagging is stable, connect those channels to CRM and revenue reporting.
Connect Analytics, CRM, and Revenue Data
Automated reporting needs four layers: web analytics, ad data, CRM lifecycle data, and revenue signals. The flow is simple: capture → sync → normalize → validate → report.
Here’s what that means in practice. Capture happens through tracking codes and UTMs. Sync happens through API connections between platforms. Normalize means you apply the same channel group rules and naming rules across the stack. Validate means you run quality checks before anything reaches a dashboard. Report is the final automated output.
The analytics-to-CRM handoff is where custom attribution models usually fall apart. To keep it intact, capture session source/medium in a hidden form field or cookie at the moment of conversion, then pass that value into the CRM as the lead source [6][12]. That’s what lets you trace AI discovery all the way to a closed-won opportunity.
| Data Layer | Primary Source | Key Metrics to Map |
|---|---|---|
| Analytics | GA4 | Sessions, Key Events, Traffic Source, Landing Page |
| Ad Platforms | Google/Meta Ads | Impressions, Clicks, Ad Spend |
| CRM | HubSpot/Salesforce | MQLs, SQLs, Opportunity Stage, Lead Source |
| Revenue | Billing/ERP | Closed-Won Revenue, LTV, CAC |
After the data starts flowing, test it before AI writes a single summary.
Add Data Quality Checks Before AI Summaries
AI summaries make bad data louder.
Before your workflow generates any AI narrative, run validation checks against four common failure points. First, check for missing spend data. GA4 can’t see non-Google ad spend natively, so cost-per-lead math will be off unless you’re pulling spend from outside GA4 [1].
Second, audit spikes in Direct traffic, especially on deep informational pages like FAQs or documentation. Approximately 70% of AI-driven referral traffic is misclassified as "Direct" in standard GA4 setups [2]. If those pages jump for no clear reason, untagged AI referrals may be the cause.
Third, spot-check Page Referrer against Session Source to confirm your regex patterns match the traffic you expect [8]. Or put another way, don’t assume your pattern works just because the chart looks neat.
Fourth, verify CRM sync timing. Delays between form submissions and CRM records can create weird dips and spikes that look like campaign problems when the issue is just data lag.
Use GA4’s DebugView and Realtime reports to confirm events are firing correctly before you trust any automated output [6].
Version-stamp regex patterns, for example v2026-08, so you can track rule changes over time [8].
3. Build the AI-Powered Reporting Workflow Step by Step
Once clean, checked data moves through your stack, you can connect the automation. Order matters here. Refresh the data first, calculate KPIs second, update dashboards third, and let AI write the narrative last. Use the KPI tree and tracking rules you already set, then run the reporting workflow in that same order every cycle.
Automate Data Refresh and Metric Calculations
Set automated data pulls on a steady schedule. Use GA4’s BigQuery export when you need raw event-level data for full pipeline joins, or use Looker Studio connectors when you want a faster view of GA4, Google Ads, and CRM data in one place [1][3].
Keep lookback windows the same every time. If your team uses 7-day and 30-day comparison windows, stick with those for weekly and monthly reviews.
For KPI calculations, automate these six management blocks: leads/key events, CPL, traffic trend, channel movement, one win, and one issue [1]. Then join GA4 key events to paid-spend data so CPL stays accurate across channels [1].
Build the Traffic-Acquisition Dashboard and Delivery Cadence
Keep the dashboard layout the same in every reporting cycle so the AI has a stable structure to summarize. Use the same core blocks each time, and keep the format short enough that the main story jumps out fast.
Automate three delivery tiers on a fixed schedule:
- A daily anomaly check
- A weekly acquisition report for top channel performance across the prior 7 days
- A monthly ROI review focused on marketing attribution models and ROI [3]
Generate AI Narratives With Guardrails
Feed the AI the same structured output every time so the summary stays steady. Pass in the six KPI blocks, including source/medium, channel group, campaign, landing page, and conversion, with current values, previous-period values, and percentage changes already calculated. Ask the AI to explain why the numbers changed instead of only repeating them, and tell it to summarize only metrics that moved by more than 15% [1][11]. Use an AI layer that can read the structured KPI object, query live data, and draft clear summaries [11].
Two guardrails are non-negotiable.
- Every summary must include raw numbers. Percentages without absolute figures make it easy for bad data to slip through.
- Every summary needs human approval before distribution, plus a check against tracking and business context [7][11].
It might surprise you to hear that reports with plain-language comments next to numbers are referenced by management 74% of the time, while raw session counts get referenced only 27% of the time [1]. Keep the format short, keep the numbers visible, and keep a human in the loop before it goes out.
4. Operationalize the Workflow in Marketing Ops
Once the workflow is built, turn it into a process your team owns. A one-off workflow won’t hold up as a system. Give it clear ownership, validate it, and keep an eye on it.
Assign Owners and Run a Parallel Validation Period
Marketing Ops owns dashboards and channel rules. Analysts own diagnostics. Campaign managers own UTM integrity. The marketing director approves the final action.
| Role | Responsibility | Key Output |
|---|---|---|
| Marketing Ops Manager | Automation and governance | Connected dashboards (Looker Studio/GA4) |
| Marketing Analyst | Diagnostics | GA4 Explorations & trend analysis |
| Campaign Manager | UTM tagging & source integrity | Clean referral/source data |
| Marketing Director | Strategic approval & action | Final action per report |
Before you go live, run automated reports alongside your current manual process for 2 to 4 weeks. GA4 data processing can take 24 to 48 hours, and in some cases up to five days, to fully populate [5]. That overlap gives you time to spot mismatches before leadership sees them.
During this period, watch your "Unassigned" traffic closely. Keep Unassigned under 5%. Anything above 10% means you’re making budget calls on a partial dataset [13]. Use this window to reconcile gaps before you retire the manual process. Keep both systems running until the outputs match.
Monitor Failures, Drift, and Reporting Accuracy
Once you go live, the biggest risk is silent drift. A connector stops refreshing and no one notices. A UTM rule gets overridden. A channel that used to land cleanly in one bucket starts showing up in "Unassigned."
Set refresh alerts, and block distribution until freshness, tracking, and attribution checks pass.
Set up refresh-status alerts so you know right away when a data pull fails. Cross-check GA4 numbers against secondary sources like Search Console, ad platform reports, or server logs at least weekly. Gaps above 5% to 15% usually point to broken tracking [3]. Also keep an eye on spikes in "Direct" traffic. That often means referrer data is getting stripped by mobile apps that strip referrers, such as ChatGPT, which causes sessions to land in "Direct" instead of a tracked source [10].
Treat any tracking, freshness, or attribution failure as a stop-ship issue.
Expand From Acquisition Reporting to Broader MOps Analytics
The acquisition workflow is your proof of concept. Once it’s stable, checked against secondary sources, and guiding management decisions on a steady basis, you’re ready to extend it.
The next moves are CRM first-touch attribution and BigQuery path analysis. These aren’t separate efforts. They plug into the same data base and reporting cadence you’ve already built.
As your MOps analytics footprint grows, the governance rules you set in Step 1 matter even more. Document every change to custom channel groups so you always know what was being measured and when [8].
With ownership and monitoring in place, the last step is to launch the smallest version that still works.
Conclusion: The Minimum Viable AI Reporting System to Launch First
This is your launch point. Start with one report, run it end to end, and then expand.
Go live only when the full system is in place: the KPI tree, tracking, CRM sync, automation, AI summary, and human review. That setup gives you a report you can actually trust.
Missing referrers and direct misclassification can skew budget decisions fast, so check the first report against manual reviews before you scale. It might surprise you to hear that a small tracking gap can throw off much bigger calls downstream.
Once the first report proves accurate, widen the scope. After one full month of clean matches against manual checks, expand the workflow and keep the governance rules, ownership model, and validation cadence in place as you add more reporting.
FAQs
How much of this workflow can I automate safely?
You can safely automate most marketing and traffic-acquisition reporting, as long as you keep a hybrid workflow with human oversight.
Automation works well for the repetitive parts:
- data aggregation
- Looker Studio dashboard refreshes
- recurring anomaly detection
However, interpretation should stay human-led. AI tools can strip referrer data and create attribution gaps, so automated reports should flag issues, not make the final call.
In other words, let the system surface the smoke, then check for fire yourself. Compare GA4 with Search Console or server logs before you trust what the report is telling you.
What should I do if AI traffic keeps showing up as Direct?
This usually means the referrer header got stripped before the visit reached GA4, so GA4 drops that session into Direct traffic.
To handle this, keep an eye on Direct traffic next to known AI referral growth. Use UTM parameters when you can. Also look closely at Direct visits that land on content-heavy pages and show strong engagement, because that pattern often hints that more AI-driven traffic is in the mix than GA4 shows on the surface.
You can also set up custom channel groups and reports to get a clearer view. In other words, GA4’s AI traffic numbers are a floor, not a ceiling.
When should I use GA4 only vs. connect CRM and revenue data?
Use GA4 only when your goal is to understand website behavior, traffic sources, or engagement metrics. It gives you a fast, centralized view of how your site is performing.
Connect CRM and revenue data when you need to measure the financial impact of that traffic. GA4 can’t access ad spend or your sales pipeline on its own, so you need that connection to track metrics like cost per lead, opportunity creation, and closed-won revenue.