
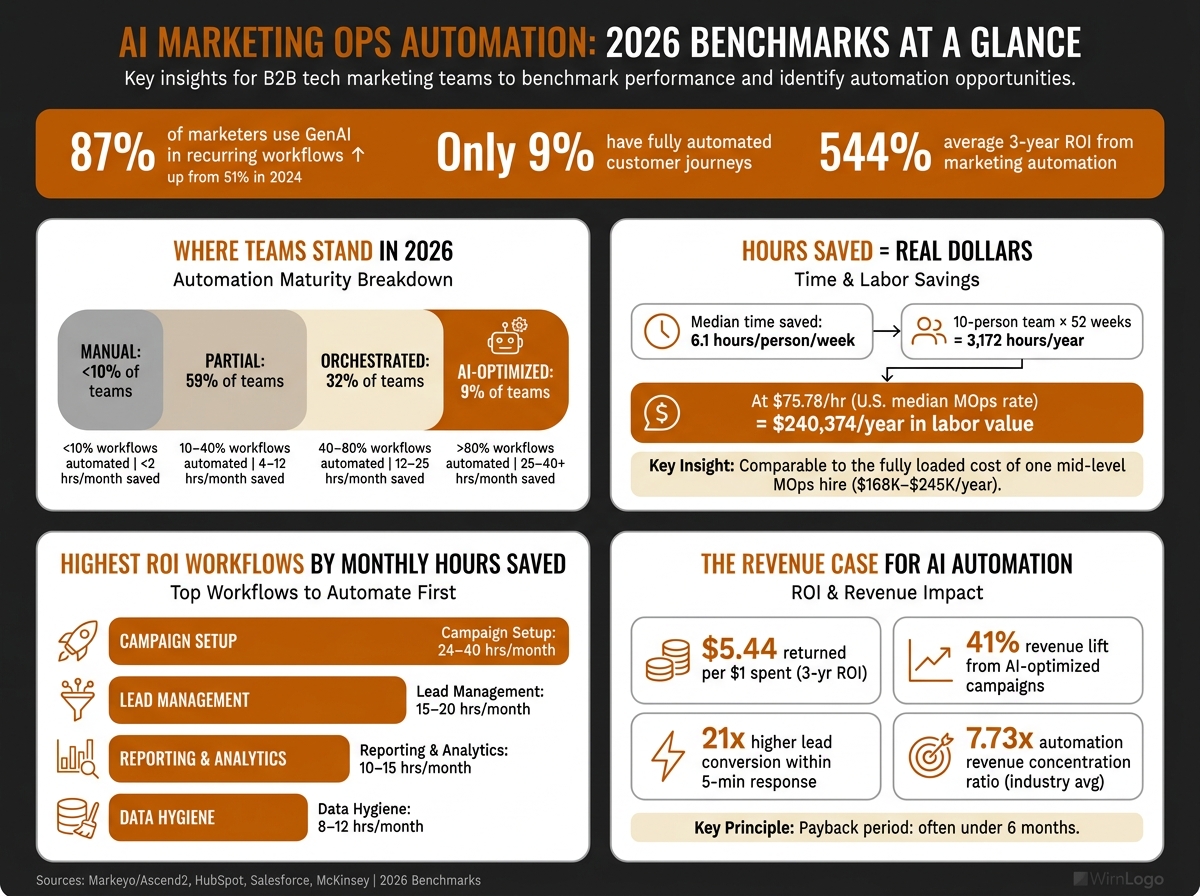
If you want the short version, here it is: AI use in MOps is now common, but deep automation is still rare. 87% of marketers use GenAI in at least one recurring workflow, yet only 9% run fully automated customer journeys. For most U.S. B2B tech teams, the best path is simple: automate repeatable work first, track time saved in dollars, and measure revenue lift separately.
I’d sum up the 2026 benchmark like this:
- Adoption is high: GenAI use jumped from 51% in 2024 to 87% in 2026
- Depth is low: only 9% of teams have fully automated journeys
- Best first workflows: lead routing, reporting, data hygiene, and lifecycle triggers
- Time saved adds up fast: a 10-person team saving 6.1 hours per week per person gets back about 3,172 hours per year, or about $240,374 at $75.78/hour
- Payback is often fast: many teams see payback in under 6 months
- What blocks progress: lack of expertise, system integration issues, and poor data quality
It might surprise you to hear that the gap is not tool access. The challenge here is moving from scattered task automation to connected workflows across scoring, segmentation, timing, reporting, and follow-up. In other words, plenty of teams use AI, but far fewer use it in a way that changes output and revenue.
Here’s the quick comparison I’d keep in mind:
| Metric | 2026 Benchmark |
|---|---|
| GenAI use in recurring workflows | 87% |
| Fully automated customer journeys | 9% |
| Partial automation | 59% |
| Orchestrated automation | 32% |
| Median time saved per person | 6.1 hours/week |
| 3-year marketing automation ROI | 544% |
| Common payback window | Under 6 months |
When I read these numbers, the takeaway is pretty clear: you do not need to automate everything first. You need to start where the work is repetitive, the hours are easy to count, and the link to pipeline is easy to show. That gives you a cleaner case for budget, hiring, and workflow changes.
The rest of the article breaks that down into adoption rates, share of workflows automated, annual hours saved, and ROI, so you can compare your team against the 2026 baseline without getting lost in tool hype.
AI Marketing Operations Automation Maturity Benchmarks 2026
2026 Adoption Benchmarks for AI Marketing Operations Automation
Overall Adoption of Marketing Automation and AI in MOps
In 2026, 87% of marketers use generative AI in at least one recurring workflow, up from 51% in 2024 [4]. That’s a big jump. However, broad use doesn’t mean deep automation.
The pattern is pretty clear: GenAI shows up across many workflows, but only a small slice of teams have pushed all the way to full automation. That gap between broad use and shallow automation is the lens that matters for the benchmarks below.
Only 9% of organizations report fully automated customer journeys, while 59% remain in partial automation [1]. A separate data point tells the same story from another angle: just 8% of B2B organizations say their AI implementation is "advanced or leading" [3].
| Maturity Level | % of Organizations | What It Looks Like |
|---|---|---|
| Partial Automation | 59% | Automation used for isolated tasks, such as email sends and scheduling |
| Orchestrated | 32% | Orchestrated workflows across multiple touchpoints |
| AI-Optimized | 9% | End-to-end customer journey orchestration and integration |
Adoption Rates by Workflow Category
Adoption is strongest in repetitive, rules-based work. Administrative tasks like scheduling and documentation lead at 93% adoption, with data analysis and reporting close behind at 92% [1]. Email marketing reaches 71% [1].
Some higher-value use cases are moving fast too. Lead scoring climbed to 61% adoption in 2026, up from 23% in 2024 [3]. AI-enabled ABM personalization and predictive analytics now sit at 78.7% [3].
The pattern here matters. Teams adopt AI first where the work is repeatable and easy to slot into a process. As the workflow gets more predictive or crosses more teams, adoption drops. You can see that in standalone predictive AI, which remains far lower at 15% adoption [10].
What These Adoption Patterns Mean for U.S. B2B Tech Teams
For U.S. B2B tech teams, company size shapes how this plays out day to day. Startups with fewer than 50 employees usually don’t have a dedicated MOps function, so automation work lands with generalists. In mid-market companies, especially in the 200 to 2,000 employee range, MOps hiring is growing fast, and a lot of that work centers on stitching together fragmented toolstacks [11].
The challenge here is expertise. 48.6% cite lack of expertise as their main automation barrier [1]. In other words, small teams often lack MOps depth, mid-market teams tend to automate more, and know-how is still the bottleneck that slows deeper rollout.
Workflows Automated and Hours Saved by Team Maturity
Core MOps Workflows Most Commonly Automated in 2026
Some workflows save a lot more time than others. In 2026, the clearest ROI comes from repetitive, rules-based work like lead scoring and routing, automated reporting, data hygiene, and behavior-based triggers such as demo-request, content-download, or site-visit follow-up flows [5][6].
Across workflow categories, campaign setup, lead management, reporting/analytics, and data hygiene drive the biggest monthly time savings: 24–40 hours, 15–20 hours, 10–15 hours, and 8–12 hours, respectively [12][3][1][6][5]. Or put another way, if your team still handles list cleaning, DMARC checks, and enrichment by hand, you’re burning time that automation can give back. Those database maintenance tasks alone save 8–12 hours per month when automated [6][5].
The next step is simple: turn those saved hours into annual labor value.
Hours Saved Per Year and Labor Savings in U.S. Dollars
The time savings from MOps automation stack up fast, even on a small team. 54% of marketers save 1–5 hours per week with AI, while 31% save 6–10 hours [6]. At the median, marketers save 6.1 hours per week with AI [4].
For a lean team of 10 people, that adds up quickly. If each person saves 6.1 hours per week, the team saves about 3,172 hours per year. At the U.S. median MOps hourly rate of $75.78, that’s about $240,374 in labor value [2].
For context, a mid-level U.S. MOps manager’s fully loaded year-one cost sits between $168,000 and $245,000 [2]. In other words, the saved time can match the cost of an added hire.
Maturity Model: Manual, Partial, Orchestrated, and AI-Optimized
How much of that upside a team can reach depends on maturity. Teams in the Manual stage automate fewer than 10% of recurring workflows and save less than 2 hours per month per person. At the Partial stage, which includes 59% of organizations [1], teams automate 10–40% of workflows and usually save 4–12 hours per month.
The Orchestrated stage covers 40–80% of workflows and saves 12–25 hours per month. 32% of organizations are in this group [1]. The AI-Optimized tier includes just 9% of teams [1], but those teams automate more than 80% of workflows and save 25–40+ hours monthly.
The biggest jump comes when teams move from isolated automations to one connected workflow across segmentation, content, timing, and subject lines. That’s the setup tied to a 41% revenue lift [5][8].
| Maturity Stage | % of Teams | Typical % of Workflows Automated | Median Monthly Hours Saved (Per User) | Common AI Use Cases |
|---|---|---|---|---|
| Manual | <10% | <10% | <2 hours | Basic template usage, ad-hoc reporting |
| Partial | 59% [1] | 10–40% | 4–12 hours | Email marketing, admin tasks, social scheduling |
| Orchestrated | 32% [1] | 40–80% | 12–25 hours | AI lead scoring, data analysis and reporting, multi-step nurture flows |
| AI-Optimized | 9% [1] | >80% | 25–40+ hours | Predictive personalization, dynamic send-time optimization, full-stack AI workflows [5][6] |
Use these maturity bands to estimate payback in the ROI section below.
ROI Benchmarks and How to Measure MOps Automation Payback
2026 ROI Benchmarks: Return Range, Payback Period, and Success Rate
Marketing automation returns $5.44 for every $1 spent over three years, or 544% ROI [13]. Email does even better. Email marketing averages $36-$42 per $1 spent, and segmented, automated, AI-optimized programs in the U.S. hit $60-$76 per $1 [5].
Most teams start seeing positive results within a year, and payback often shows up in under six months [13]. In practice, the first wins usually come from efficiency. Revenue takes more time to tie back with confidence, but it tends to drive the bigger return. That’s why the hours-saved benchmarks above are the right place to start when you calculate payback.
The next job is simple: figure out which results are doing the heavy lifting.
The Outcomes That Drive MOps Automation ROI
Once you’ve nailed down time savings, revenue lift becomes the next big lever.
Using AI across segmentation, personalization, send-time optimization, and subject-line testing drives a 41% revenue lift compared with non-AI campaigns [5][8]. That’s a big jump, and it usually comes from a stack of small gains that add up fast.
Speed also matters more than most teams expect. In 2024, 62% of teams needed two weeks or more to deploy a campaign. By 2026, 76% of teams launch in under 3 days [14][6]. Shorter launch cycles mean more tests, more iterations, and fewer missed windows.
Lead response time has a direct link to revenue. Leads contacted within 5 minutes convert at 21x the rate of leads contacted later [3]. AI-assisted qualification helps teams hit that window without adding headcount, which is where the math starts to get interesting.
When teams miss ROI targets, the usual problems are pretty consistent:
- System integration issues (34%)
- Skills gaps (27%)
- Poor data quality (25%) [14]
A Practical ROI Measurement Framework for Marketing Operations Leaders
MOps leaders often make ROI look better than it is because they count tool costs and skip the rest. Track ROI against fully loaded costs, not just software spend. That means you include the ESP license, campaign management time, list hygiene costs, and copywriting. Even with that stricter model, returns still land between 1,200% and 1,800% [5], which gives you a much stronger number in a budget review.
It helps to track efficiency and revenue as separate lines. In other words, show what changed in operations first, then show what changed in output. That makes the before-and-after story much easier to defend.
| Metric | Manual | Automated | AI-Optimized |
|---|---|---|---|
| Campaign Setup Time | 8-14 days [7] | 3-7 days [7] | <3 days (often minutes) [6][7][14] |
| Operational Cost Reduction | Baseline | 25-30% lower [13] | Up to 55% labor savings [7] |
| Conversion Rate | 0.08% [9] | 1.49% [9] | 2.5% (B2B) [5] |
| Revenue Per Recipient | $0.155-$0.18 [5][9] | $2.87 [5] | $3.41+ [9] |
Two more metrics are worth tracking. Revenue Per Campaign (RPC) is a useful middle step when full multi-touch attribution isn’t in place yet [15]. Automation revenue concentration shows whether automated flows produce revenue above their share of send volume. The 2026 industry average is 7.73, which means automated workflows generate over 7x more revenue relative to their send volume than manual campaigns [5].
AI Marketing Tool ROI Benchmarks for B2B SaaS (2026)
How B2B Tech Teams Should Use These Benchmarks in 2026
Use the benchmarks above as a prioritization rubric.
What to Automate First for the Fastest Near-Term Return
The fastest payback usually comes from workflows that happen all the time and slow people down. Start with lead routing, lifecycle triggers, reporting, and data hygiene. Those are the places where small fixes can save a lot of time.
Before you scale send volume, lock down SPF, DKIM, and DMARC. This part matters more than a lot of teams think. Authenticated senders reach 85% to 95% inbox placement, while unauthenticated domains fall below 50% [5].
Next, score your current workflow stack against the same four metrics.
How to Compare Your Team Against the 2026 Benchmarks
A simple self-audit looks at four things: adoption level, percent of workflows automated, hours saved per week, and ROI. Start with what you can measure today, even if the picture is incomplete.
Check deployment speed first. The 2026 standard is 3 days or less [6][7]. If your team needs weeks to launch a basic automation, that’s a clear signal.
Next, calculate your Automation Revenue Concentration Ratio. Divide your automated flows’ share of total revenue by their share of total send volume. The 2026 industry average is 7.73 [5]. In other words, this gives you a quick read on whether your automated flows are pulling enough weight.
Then convert saved hours into fully loaded labor value. That helps you tie time savings to actual dollars, instead of treating them like a soft win.
Last, check where you sit in the maturity split. 59% of teams are still in partial automation, 32% are mostly automated, and only 9% have fully automated customer journeys [1]. That context helps you judge the next move with a clear head.
Key Benchmark Takeaways for MOps Planning
The main lesson here is sequence. Adoption is broad. 87% of marketers now use GenAI. However, maturity is still thin, with only 9% running fully automated journeys [1][4]. That gap is where most teams are operating, and it’s where a lot of efficiency gains still sit.
These benchmarks work best as a prioritization tool, not as an excuse to buy more software. Put budget into training, process design, and data foundations. Unfortunately, expertise and staffing are still the main blockers [1].
Report operational lift and revenue lift separately.
FAQs
How do I calculate MOps automation ROI?
Start with a 90-day baseline for marketing-sourced revenue and performance. Then estimate return from incremental revenue tied to AI-driven pipelines, adjusted for win rate, average sales price, and marketing credit.
Use controlled testing, such as geo-holdouts or staggered rollouts, to isolate impact. That gives you a cleaner read on what AI changed versus what would’ve happened anyway.
From there, subtract total cost of ownership, including setup and implementation. Report the hard metrics, like hours saved and lower customer acquisition costs, alongside softer productivity gains.
Which workflows should we automate first?
Start with high-revenue, repeatable workflows that can show impact fast. Use the last 90 days of performance data as your baseline so you can measure what changed and what paid off.
Focus first on a few areas that tend to move the needle early:
- Email lifecycle sequences
- Lead response and qualification
- Content production
It might surprise you to hear that the setup work matters just as much as the workflow itself. Before you scale automation, make sure your data foundation is unified and clean. If systems don’t connect well or your data is messy, ROI drops fast and results get hard to trust.
How do we know our team’s automation maturity?
Assess your team’s automation maturity by looking at AI integration across core workflows, not just tool adoption. While 87% of teams use AI, only 12% are fully integrated.
More mature teams weave AI into audience segmentation, content personalization, and optimization. In other words, AI shows its value when it becomes part of how the work gets done every day, not when it sits off to the side as a separate tool.
For a quick self-check, look at a few basics:
- Data quality: Can your team trust the inputs that feed your AI systems?
- Baseline performance: Review the last 90 days so you can compare AI-assisted work against a clear starting point.
- Human oversight: Can your team monitor, review, and guide AI-driven processes instead of letting them run unchecked?
That last point matters more than people think. The good news is you do not need perfect systems on day one. You need a setup where AI supports the workflow, your team can spot issues early, and performance stays tied to business outcomes.