
Here’s what you need to know about B2B SaaS in 2026:
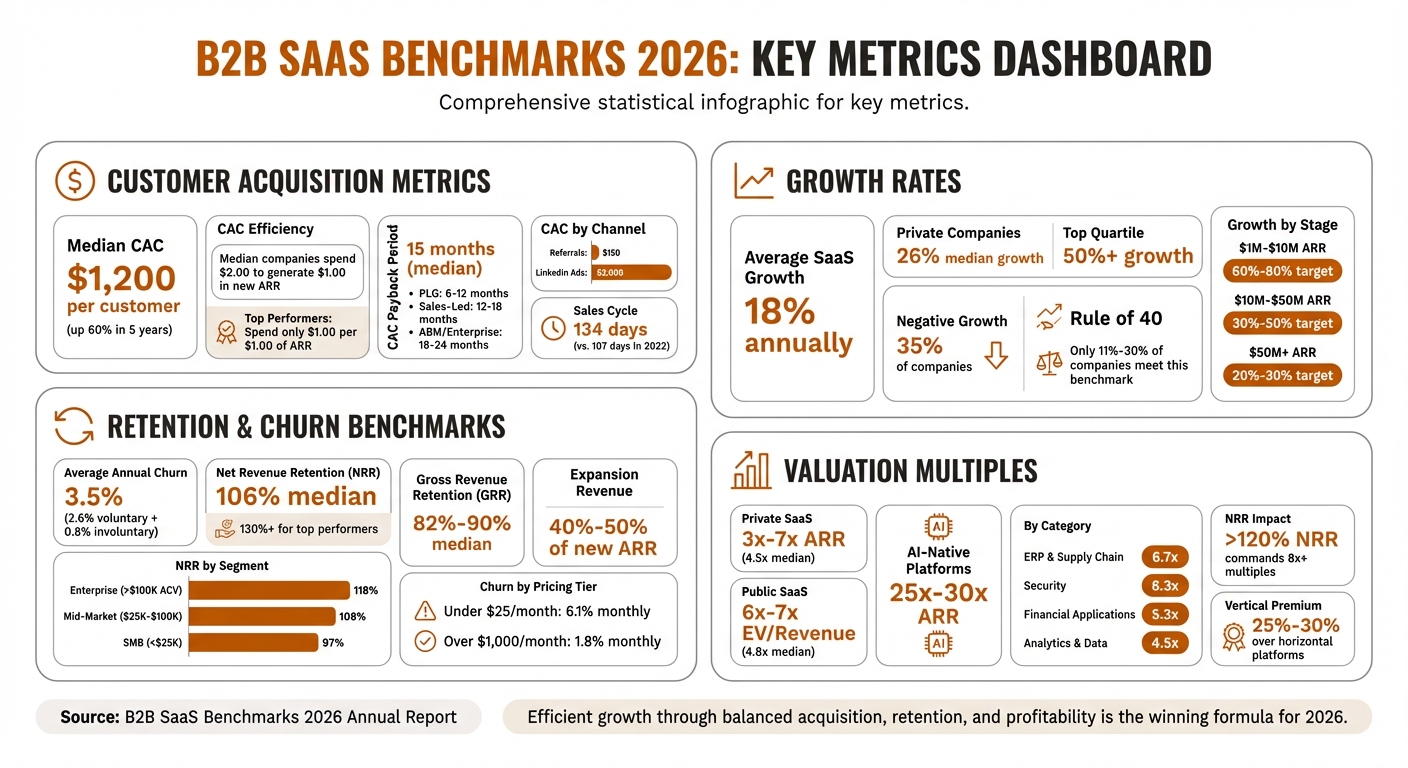
- Customer Acquisition Costs (CAC): Median CAC has surged to $1,200 per customer, with the median company taking 20 months to recover that cost and top performers landing under 12. Rising ad costs (Google Ads up 164%, LinkedIn Ads up 89% since 2019) are driving this increase.
- Retention Over Acquisition: Median Net Revenue Retention (NRR) sits at 101% per Benchmarkit’s 2025 B2B SaaS Performance Metrics benchmarks, with top performers exceeding 130%. Expansion revenue now accounts for 40%-50% of new ARR.
- Growth Challenges: Median growth has slowed to 22%, down from 25% in 2024, according to SaaS Capital’s 2026 survey of 1,000+ private B2B SaaS companies. Only 11%-30% meet the Rule of 40, a key metric for growth and profitability.
- Valuation Multiples: Private SaaS companies trade at 3x–7x ARR, while AI-native platforms command much higher multiples (25x–30x).
Key Takeaway: Efficient growth is what gets rewarded now. I’ve watched the focus move from growth at all costs to balancing acquisition, retention and profitability. If you’re strong on CAC payback, NRR and retention, you’re the company securing the higher valuation.
I’m Lillian Pierson, a fractional CMO and licensed Professional Engineer who’s built growth solutions for B2B SaaS and AI companies, from VC-backed startups to IBM, Intel and SAP, and these are the benchmarks I hold my own clients to.
Want specifics? Let’s dive in.
B2B SaaS Benchmarks 2026: Key Metrics for CAC, NRR, Growth and Valuation
Contentful x Benchmarker: 2026 B2B SaaS Content and Website Performance Benchmarks
Customer Acquisition Metrics for B2B SaaS
How fast you recover acquisition costs tells me more about your efficiency than almost any other number on this page. The recent data isn’t encouraging: the median B2B SaaS company now spends $2.00 to generate $1.00 in new ARR [6]. On average, customer acquisition costs (CAC) have surged to $1,200 per customer [3]. This spike is largely driven by rising media costs and longer sales cycles, which have stretched to an average of 134 days compared to 107 days in early 2022 [7].
The top performers look nothing like the median. Those in the top quartile spend just $1 per $1 of ARR, while their fourth-quartile counterparts spend $2.82 [7]. What separates them is almost always channel strategy and execution, and you can see it in the channel costs. Referral programs, for instance, deliver the most cost-effective results at $150 per customer, whereas LinkedIn Ads demand a hefty $2,000 per customer [3]. A standout example is TripMaster, a transit software provider, which added $504,758 in net new ARR with an impressive 650% ROI by focusing on high-intent paid search and optimizing conversion rates [4,9].
Median CAC and Industry Trends
Your industry sets a floor under your CAC before you do anything. Fintech companies targeting SMBs encounter the steepest CAC, ranging from $1,450 to $1,461, while HR Tech averages $410, and eCommerce SaaS companies manage a lower $299 [4,10]. As businesses grow, their CAC naturally increases. Seed-stage companies with $0–$1M ARR spend between $150 and $400 per customer, aiming for a payback period under 12 months. In contrast, scale-stage organizations ($100M+ ARR) invest $800–$2,500 per customer and accept payback periods of over 20 months [2,9].
"Median B2B SaaS companies now spend $2 to acquire $1 of new ARR, which exposes weak unit economics." – Aaron Rovner, SaaSHero [6]
To offset acquisition costs, you’ll see most companies leaning on expansion revenue, which now accounts for about 40% of new ARR [9,10]. Small changes move this more than you’d expect. For example, removing credit card requirements during trials has been shown to double the number of paying customers, while personalized marketing campaigns outperform generic ones with a 202% higher conversion rate [7].
Conversion Rates Across Marketing Funnels
Your GTM model moves conversion more than most founders expect. Companies choosing Product-Led Growth vs Sales-Led Growth see different results: PLG models typically achieve visitor-to-lead conversion rates of 3%–9%, while Sales-Led models lag behind at 0.5%–1.5% [8]. Further down the funnel, MQL-to-SQL conversion rates average 32%–40%, with SEO-sourced leads converting at 51% and PPC-sourced leads at 26% [11,12,13].
In 2026, Playvox, a customer experience software provider, achieved a 10x reduction in cost per lead while increasing lead volume by 163%. This was accomplished through improved account structuring and better use of negative keywords [4,9]. Trial-to-paid conversion rates also show significant variation, ranging from 12%–35%, with elite PLG companies reaching as high as 56% [9]. Engaging active trial users has proven to increase conversion likelihood by 70% [7]. These efficiencies have a direct impact on CAC payback periods.
CAC Payback Period by Business Model
Your payback period comes down to conversion efficiency and channel strategy. The median payback for B2B SaaS stands at 20 months, per Benchmarkit’s 2025 B2B SaaS Performance Metrics benchmarks. However, this figure masks substantial differences across business models. PLG companies typically achieve payback within 6–12 months, Sales-Led models require 12–18 months, and Account-Based Marketing (ABM) strategies for enterprise deals often extend to 18–24 months [6]. Smaller deals with an ACV under $5,000 tend to pay back in 8–9 months, while enterprise contracts exceeding $50,000 ACV can take up to 24 months [4].
One standout case is TestGorilla, which achieved an 80-day payback period in early 2026 by leveraging a LinkedIn competitor conquesting strategy within the HR Tech space [11]. This kind of efficiency is increasingly expected by investors, who now look for payback periods between 80 and 180 days from early-stage companies before committing capital [11]. Companies with payback periods exceeding 18 months often face scrutiny, signaling a need to refine their go-to-market approach [9,17].
| GTM Motion | CAC Payback Period | Typical NRR | Growth Rate |
|---|---|---|---|
| PLG (Usage/Self-Serve) | 6–12 months | 105% | 40–60% |
| Sales-Led (Subscription) | 12–18 months | 102% | 25–40% |
| ABM (Enterprise) | 18–24 months | 100% | 15–30% |
Retention and Churn Benchmarks in 2026
Acquiring customers is the easy half. Retention is where your growth actually compounds, and as acquisition costs climb, keeping and expanding the customers you already have stops being optional.
Retention metrics play a crucial role in shaping sustainable SaaS growth strategies. Median gross revenue retention has slipped from 90% to 88% over the past three years, per Benchmarkit’s 2025 B2B SaaS Performance Metrics benchmarks. That slide tells you more than any blended churn average, because churn itself swings hard depending on customer segment and pricing tier.
Churn Rates and Retention Metrics
Your churn depends on who you sell to more than on how good your product is. For instance, enterprise customers with annual contracts exceeding $100,000 experience monthly churn rates between 0.5% and 1% (6%–10% annually). In contrast, SMB customers on self-serve plans face significantly higher churn rates, ranging from 3% to 7% monthly (31%–58% annually). Additionally, software purchased by C-suite executives is retained 3.6 times longer than tools acquired by managers or individual contributors.
Your industry moves it too. Infrastructure SaaS companies report the lowest monthly churn at 1.8%, while EdTech companies encounter the highest at 9.6%. Marketing and sales tools fall between 4.8% and 8.1%, and HR software averages 4.8%. Pricing tiers further affect retention. Customers paying under $25 per month churn at 6.1% monthly, while those spending over $1,000 churn at a much lower rate of 1.8% [14].
Involuntary churn, stemming from failed payments, accounts for 20% to 40% of total churn in SaaS [14][17]. Implementing smart dunning systems and automated retry processes can recover up to 70% of this lost revenue [19].
"The fastest way to reduce churn for most SaaS companies isn’t a new feature or a better onboarding flow – it’s fixing the dunning sequence. You’re literally throwing away revenue that customers want to give you." – Lincoln Murphy, Customer Success Consultant, Sixteen Ventures [14]
Those churn numbers set up the retention metrics that matter more.
Net Revenue Retention (NRR) Insights
Net Revenue Retention (NRR) measures revenue growth from existing customers, factoring in expansions, contractions, and churn. An NRR above 100% indicates a company can grow without acquiring new customers. In 2026, the median NRR for B2B SaaS companies stands at 106%, with top performers exceeding 130% [16][10][17].
Your NRR will look very different depending on who you sell to. Enterprise accounts (annual contract value over $100,000) achieve a median NRR of 118%, mid-market accounts ($25,000–$100,000 ACV) average 108%, and SMBs (ACV below $25,000) typically see 97% [16]. Examples of high performers include Datadog, which reported an NRR of 130% in Q3 2024, Veeva at 120%, and Toast at 115%. Snowflake consistently surpasses 130% NRR, enabling it to grow 30% annually purely through customer expansions [2].
A high NRR can hide churn sitting underneath it, the trap people call "100% NRR." I always ask for Gross Revenue Retention (GRR) alongside it. For B2B SaaS, the median GRR ranges from 82% to 90% [13]. A GRR above 95% in enterprise segments often signals a strong product-market fit, while lower GRR may indicate weak product stickiness [18][6].
LTV:CAC Ratios and Retention Strategies
LTV against CAC is the ratio I check first when a founder asks whether their growth is sustainable. A minimum LTV:CAC ratio of 3:1 is considered healthy [5]. Falling short of this benchmark can lead to financial losses, especially for companies aiming to recoup CAC within 12 months [5].
Effective strategies to improve retention include:
- Onboarding Improvements: Streamlined onboarding processes can reduce churn by up to 20% and help customers integrate more effectively [19].
- Integrations: Customers who adopt three or more integrations churn at roughly one-third the rate of standalone users. This creates stronger data dependencies and higher switching costs [14].
- Proactive Monitoring: Usage-based alerts that detect declines in logins or feature adoption can identify churn risks 30 to 60 days in advance [18][14].
| Segment | Monthly Churn | Annual Churn | Target NRR |
|---|---|---|---|
| SMB (Self-Serve) | 3%–5% | 31%–46% | 95%–105% |
| Mid-Market | 1%–3% | 11%–31% | 105%–115% |
| Enterprise | <1% | <11% | 115%–130% |
Expansion revenue now offsets about 50% of the impact of customer churn [17]. Companies achieving NRR above 120% often employ usage-based pricing models, offer multiple products, and prioritize proactive customer success initiatives. Quarterly Business Reviews (QBRs) that clearly demonstrate ROI can also boost GRR from 85% to 92% [19]. Shifting the focus from acquisition to retention emphasizes the growing value of nurturing and expanding existing customer relationships.
The CAC Payback I Actually Engineer For
The median B2B SaaS company takes 20 months to earn back what it spends acquiring a customer. Top performers land under 12. Those are the numbers on this page, and they’re accurate.
I engineer for 2 to 3 months.
That gap is not a rounding difference in discipline. It comes from building the acquisition motion so the product does the selling, which strips out the cost that stretches payback into years. When you’re paying a sales team to chase every deal, 20 months is what the maths gives you. When the product acquires and the page converts, the same dollar comes back in a quarter.
On the SheetRocks build the founder set the target at 6 months, which is already aggressive against a 20-month median. I still build to 2 or 3, because a payback period that short changes what you can do next: you can reinvest the same dollar three or four times a year instead of waiting two years to spend it twice.
The two numbers I watched every week
Every benchmark above this line is a lagging indicator. NRR, CAC payback and Rule of 40 tell you what already happened. They’re built for a board deck, and they’re close to useless on a Tuesday when you’re deciding where the next dollar goes.
Taking SheetRocks from 5 users to over 1,100 in 90 days, I watched two numbers weekly. Neither one appears in the tables above.
Sales page conversion rate. This told me whether the message and the offer were landing. When it moved, the positioning was right. When it stalled, no amount of traffic was going to rescue the quarter, and spending more would only have bought a bigger audience for the wrong promise.
Cost per lead by segment inside Google Ads. By segment, never blended. Blended CPL hides the audiences quietly bleeding money, and it drags the winners down to look ordinary. Splitting it told me which segments to scale and which to cut before they ate the budget. If you want the wider view of what to track alongside it, I keep a running list in my B2B SaaS dashboard guide.
Those two were the early warning system, and they’re what keep payback at 2 to 3 months rather than 20. Green light, scale the spend. Red light, fix the page or cut the segment before spending another dollar. Getting the segment view right depends on your attribution setup.
Here’s what that produced, with no outbound, no sales team and no SDRs:
- User base up almost 200x in one month
- Email list tripled in four months at a 37% open rate
- 85x traffic growth in seven months across a 55-page conversion-optimised site
- First dollar of revenue within two months of launch
The sequence mattered more than any single tactic. I built a waitlist from LinkedIn ads that tested the product hypothesis, ran voice-of-customer interviews with people on that list, built the offer around what they told me, and launched to that warm list. Only then did I point paid traffic at the sales page. By the time cold traffic arrived, the page already spoke their language, because real customers had written it.
Two things carried that result. The first was a product-market-fit hypothesis backed by market research and voice-of-customer interviews, so the product was mapped to a problem people would pay to solve. The second was the offer itself: packaging, pricing and messaging that converted. When the offer is dialled in, ads cost less, the page converts more, and users reach value faster, because every part of the system says the same thing in the words buyers already use.
One caution, because the highlight reel misleads. This motion works when the product is tested and users stay. The funnel amplifies whatever the product already is. A good product scales on it. A shaky one fails faster and more publicly, and you’ll have paid for the audience that watched.
Revenue Growth and Valuation Benchmarks
Your growth rate and your valuation multiple are how the market reads your company. For 2026, the average annual growth for B2B SaaS companies is projected at 18%, while private companies show a median growth of 26% [1][4][6]. The top-performing companies, in the highest quartile, boast growth rates exceeding 50% [4][6]. On the flip side, 35% of companies are experiencing negative year-over-year growth [1].
What counts as good growth shifts with your stage. Notably, growth often slows at $5M and $25M in billings, creating challenging points for scaling [1]. Interestingly, AI-native platforms are outpacing traditional SaaS growth rates, even with their higher compute costs [4]. Venture capital-backed firms typically achieve median growth rates of 25%–30%, while bootstrapped companies grow slightly slower, at 20%–23% [4].
Annual Growth Rates and ARR Trends
What investors expect of you changes with your size and maturity. Early-stage companies with $1M–$10M ARR target growth rates of 60%–80%. Growth-stage firms ($10M–$50M ARR) aim for 30%–50%, while larger companies exceeding $50M ARR typically achieve growth in the 20%–30% range [6]. As the market shifts from a "growth at all costs" mindset to a more disciplined approach, the Rule of 40 – a balance of growth and profitability – has become a critical measure for investors [4][20].
If you’re building vertical, you have an advantage here. This success stems from deeper product integration and higher switching costs. Businesses with strong Net Revenue Retention (NRR) and efficient Customer Acquisition Cost (CAC) payback periods achieve average growth rates of 71% [4].
Those growth numbers are what drive the multiples below.
Valuation Multiples by Vertical
Growth guides what you do. Multiples tell you what the market thinks of it. Private B2B SaaS companies generally trade at 3x–7x ARR, with a median multiple of 4.5x [21]. Public SaaS companies, on the other hand, maintain a median EV/Revenue multiple of 6x to 7x, which often serves as an upper limit for private valuations [21][22]. As of late 2025, the SEG SaaS Index reported a median EV/Revenue multiple of 4.8x [20].
What you’re worth depends heavily on your vertical and product category. ERP & Supply Chain companies lead with a median multiple of 6.7x, followed by Security at 6.3x. Analytics & Data Management, which has become integral to AI data architecture, sits at 4.5x and was the only category to grow its multiple year-over-year, increasing by 11% [20].
| Product Category | Median EV/Revenue Multiple (Q4 2025) |
|---|---|
| ERP & Supply Chain | 6.7x |
| Security | 6.3x |
| Financial Applications | 5.3x |
| Vertically Focused | 4.6x |
| Analytics & Data Management | 4.5x |
Companies with an NRR above 120% can achieve multiples as high as 8x or more, while those with NRR below 90% often trade closer to 1.2x [21][22]. AI-native platforms, where AI serves as the core product rather than an add-on, command much higher multiples – ranging from 25x to 30x EV/Revenue [22].
"The days of double-digit revenue multiples for private companies are not coming back. What separates a 3x outcome from a 7x outcome comes down to three metrics: growth rate, net revenue retention, and Rule of 40 performance." – Khaled Azar, Livmo [21]
Impact of Vertical Focus on Growth
Vertical SaaS companies continue to command a 25%–30% premium over horizontal platforms with comparable performance [22]. This premium arises from factors like deeper workflow integration, higher customer lifetime value, and reduced churn. Products in areas like DevOps, Security, and ERP are particularly valued because they are difficult to replace once implemented [20].
In 2025, 72% of all SaaS M&A deals involved companies with AI integrated as a core feature, rather than as a secondary enhancement [20]. Strategic buyers, especially those targeting vertically focused companies with strong retention metrics, often pay premiums of 1.5x to 2.0x over Private Equity firms [22].
Bootstrapped companies typically trade at a median of 4.8x ARR, while VC-backed companies achieve slightly higher multiples, averaging 5.3x ARR [21]. U.S.-based SaaS companies generally trade at a median of 8x to 12x ARR, whereas their EU counterparts range between 7x and 10x [23]. These figures highlight the importance of aligning retention efforts and acquisition strategies to sustain growth in an increasingly competitive market.
How to Achieve Benchmark Goals
The companies pulling ahead in 2026 combine efficient acquisition, retention that holds, and decisions made on data rather than instinct. Here’s a breakdown of how to reduce CAC, improve NRR, and drive ARR growth effectively.
Reducing CAC with Smarter GTM Strategies
As customer acquisition costs climb to an average of $1,200 – a 222% increase over eight years [4,10] – addressing inefficiencies in specific channels becomes critical. Relying on blended metrics can hide problem areas, so targeting individual channels is key.
Competitor conquesting works because you’re reaching people already in the evaluation stage. By targeting keywords like "[Competitor] pricing" or "[Competitor] alternatives", TestGorilla achieved an 80-day CAC payback period, proving this method’s effectiveness [4,9,32].
Your data quality matters more than your targeting. For example, Meritt reduced its email bounce rate from 35% to under 4% by using advanced data verification tools. This shift tripled their weekly pipeline from $100,000 to $300,000 – all without growing their team [24]. Keeping bounce rates below 3% not only saves resources but also protects domain reputation.
Heuristic conversion rate optimization (CRO) is the fastest win available to you. Instead of lengthy A/B tests, companies like Playvox have seen a 10× drop in cost per lead and a 163% boost in lead volume by refining their paid search strategies and managing negative keywords [4,32,33]. TripMaster also demonstrated how optimized paid search and CRO can drive substantial ARR gains [4,9,32].
Referrals and organic content stay the cheapest acquisition you’ll find. Referral programs typically cost just $150 per customer, compared to over $2,000 for LinkedIn ads [3]. Plus, referred customers tend to have a 16% higher lifetime value and 37% better retention rates [7]. Prioritizing SEO, content marketing, and referral programs delivers strong returns before scaling paid campaigns.
Those moves set up the retention work.
Improving NRR Through Proactive Customer Success
Cutting CAC matters. Your NRR matters more. Proactive customer success management – not just reactive support – makes all the difference. Accounts with proactive engagement retain at double the rate of those without it [14].
Your first 90 days with a customer decide most of this. Most churn during this period stems from poor onboarding or delayed time-to-value. Automated check-ins at Day 14, Day 30, and Day 90 can ensure steady product adoption [14]. Additionally, customers who connect three or more integrations are much less likely to churn compared to standalone users [14].
Involuntary churn is the next thing worth your attention. Failed payments or expired credit cards account for 20–40% of SaaS churn, with about 9% of cards failing annually [14]. Smart dunning systems can recover nearly half of these failed payments by sending pre-dunning emails (seven days before card expiration) and allowing a grace period before account suspension [14].
"The fastest way to reduce churn for most SaaS companies isn’t a new feature or a better onboarding flow – it’s fixing the dunning sequence. You’re literally throwing away revenue that customers want to give you." – Lincoln Murphy, Customer Success Consultant, Sixteen Ventures [14]
Health scoring tells you where to spend your time. A composite score (0–100) based on product usage, seat utilization, and support sentiment helps teams identify healthy accounts (scores 80–100) for expansion and flag at-risk accounts (scores 60–79) for intervention [20,24]. Promoters (NPS scores of 9–10) are also 5–10× more likely to expand their accounts compared to detractors [2].
Leveraging Data-Driven Marketing for ARR Growth
With acquisition and retention working, your data becomes the growth engine. A KPI tree linking activation rates, product-qualified lead (PQL) volume, and intent scores to ARR, NRR, and CAC payback offers a clear roadmap for growth [25].
Intent-based lead scoring combines first-party behaviors (e.g., visits to pricing pages) with third-party data (e.g., competitor research) to route high-fit accounts to sales teams within 15 minutes. This approach yields conversion rates 2–3× higher than cold outreach [24].
For companies focused on product-led growth, defining PQLs around activation milestones – like achieving first value within 14 days – drives self-serve conversions better than traditional MQL models [34,21]. With 61% of B2B buyers preferring a rep-free buying experience, PQL metrics are becoming indispensable [15].
Using multi-touch attribution models helps identify the channels that truly drive the pipeline. Time-decay or data-driven models allow companies to reallocate 10–20% of their monthly marketing budget from underperforming channels to those with stronger returns [25]. With rising media costs, this kind of optimization is more important than ever [3].
Expansion revenue plays a growing role, now making up 40% of total new ARR as of 2024 and exceeding 50% for companies with ARR over $50M [15]. Usage-based tiers and upgrade prompts – triggered when customers hit 80% of their usage limit – are proven ways to boost expansion ARR. High-performing marketing teams also publish 12–20 pieces of content monthly, focusing on well-researched, cluster-based topics to build trust and authority [25].
Conclusion: Key Takeaways for 2026
In 2026 you need to hold three fundamentals: maintaining gross margins above 75%, keeping CAC payback well under the 20-month median, and achieving NRR greater than 101% [4]. These benchmarks, outlined earlier, represent the baseline for sustainable growth and are critical for earning investor confidence.
The "growth-at-all-costs" approach has been replaced by a focus on sustainable efficiency. With acquisition costs climbing, businesses must pay closer attention to unit economics. Investors now prioritize the Rule of 40 – where your growth rate and EBITDA margin add up to more than 40% – as the key metric for performance [4]. This shift highlights the increasing importance of retaining and expanding existing customer relationships.
Retention is the backbone of your growth now. Around 40% of new ARR now comes from existing customers [6], making expansion revenue a major driver. Companies with NRR above 110% not only grow faster but also secure higher valuations, even when new customer acquisition slows [4]. In this landscape, having strong customer success programs and reliable health scoring systems is no longer a luxury – it’s a necessity.
"The companies pulling ahead are those that pair strong retention with efficient acquisition, and they’re able to do this because they have the SaaS accounting and finance systems to measure what actually matters."
- Gene Godick, Founder, G-Squared Partners [4]
FAQs
What is a good LTV to CAC ratio for SaaS?
Aim for 3:1 or better. That means every dollar you spend acquiring a customer returns at least three dollars in lifetime value. Below 3:1 and you’re buying growth you can’t sustain. Much above 5:1 usually means you’re underinvesting in acquisition and leaving growth on the table, so treat a very high ratio as a signal to spend more, not as a win.
What is a good CAC for SaaS?
The median B2B SaaS company now pays about $1,200 per customer, but the number only means something next to your contract value and your industry. Fintech selling to SMBs runs roughly $1,450, HR Tech averages $410, and eCommerce SaaS comes in near $299. Judge your CAC on payback period and LTV:CAC rather than the absolute figure.
What is a good churn rate for SaaS?
There is no single good number, because churn splits hard by segment. Enterprise customers on contracts above $100,000 typically churn at 0.5% to 1% monthly, or 6% to 10% a year. SMB customers on self-serve plans churn at 3% to 7% monthly, which is 31% to 58% annually. Compare yourself to your own segment, and watch gross revenue retention alongside it. Median GRR has slipped to 88%.
What CAC payback should we target in 2026?
Target a CAC payback period under 12 months. The median B2B SaaS company now takes 20 months, so beating that median is the realistic near-term goal and sub-12 is where the efficient companies sit. Keeping your payback period shorter not only boosts customer acquisition efficiency but also accelerates your return on investment (ROI).
How can we raise NRR without hiding churn?
To strengthen Net Revenue Retention (NRR) without masking churn, prioritize clarity and effective growth strategies. Be upfront about both logo churn (customers leaving entirely) and revenue churn (declines in spending from existing customers). Pinpointing the reasons behind churn – whether it’s involuntary cancellations or silent churn – is essential to addressing the core issues.
Focus on increasing expansion revenue by leveraging upselling, cross-selling, and proactive customer success initiatives. This balanced strategy ensures NRR growth is built on authentic retention and meaningful expansion, rather than concealing underlying retention problems.
What metrics most affect our ARR valuation multiple?
The main factors shaping ARR valuation multiples are growth rate, net revenue retention (NRR), and revenue multiples. Private SaaS companies generally trade within a range of 3x to 7x ARR. Companies achieving faster growth and higher retention rates tend to secure the upper end of this range. Prioritizing improvements in these areas can have a direct impact on boosting your valuation.