


Are you showing up in AI search results? If someone asks ChatGPT or Google AI about tools in your category, will your brand appear? Most B2B tech teams don’t know – and that’s a problem. AI-driven traffic is growing fast (800% year-over-year), and AI-referred visitors convert at 14.2%, compared to just 2.8% for traditional search. The opportunity is huge, but only 16% of brands are tracking their AI search visibility.
Here’s what you’ll learn in this guide:
- Key Metrics: How to measure AI visibility with stats like citation frequency, share of voice, and prompt coverage.
- Tools to Use: What features to look for in AI search visibility tools (multi-model tracking, sentiment analysis, etc.).
- How to Start: Step-by-step instructions for building and maintaining your dashboard.
Why does this matter? AI search isn’t like traditional SEO. There’s no static “position 1.” It’s about being included in responses, cited as a credible source, and described the way you want. If you’re not part of the AI conversation, you’re missing out on buyers who are ready to convert.
Let’s break down how to build an AI visibility dashboard that works for your team.
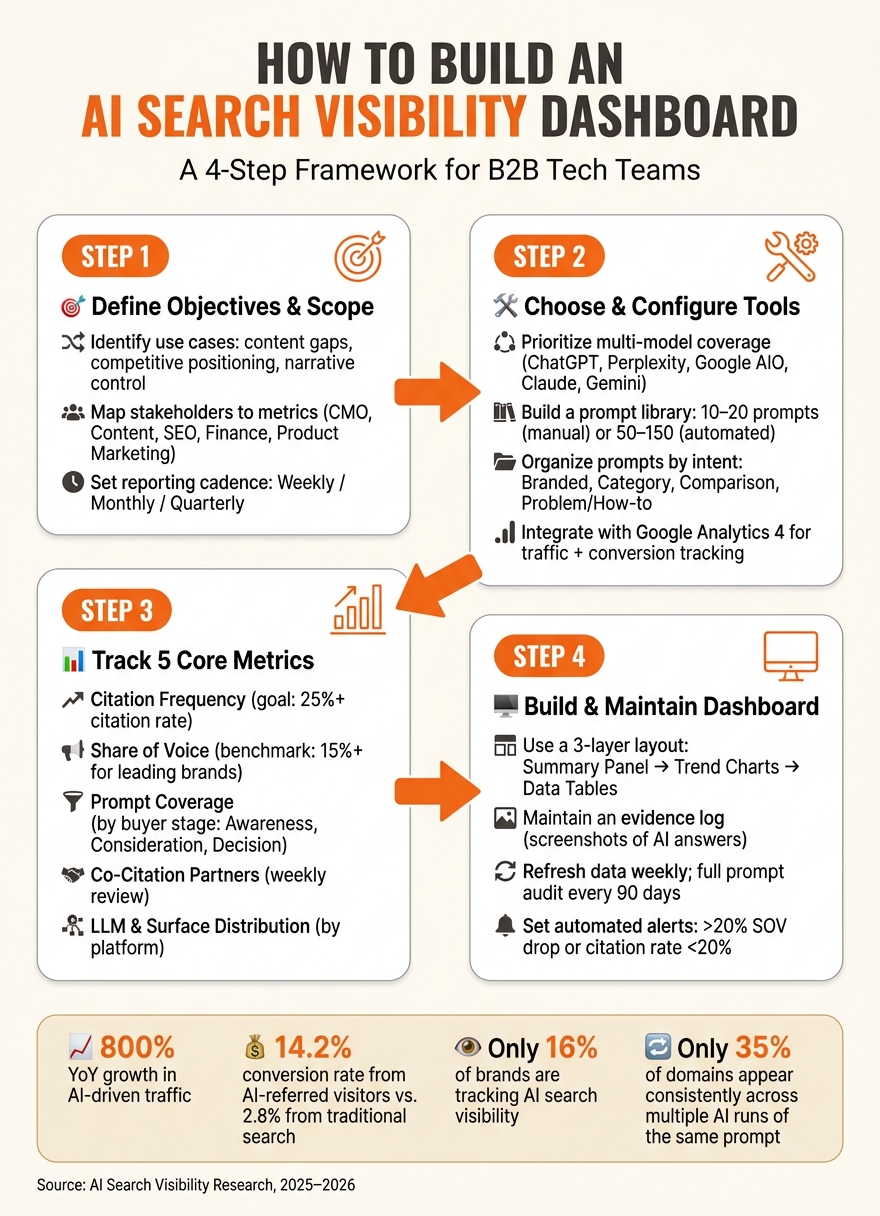
How to Build an AI Search Visibility Dashboard: 4-Step Process
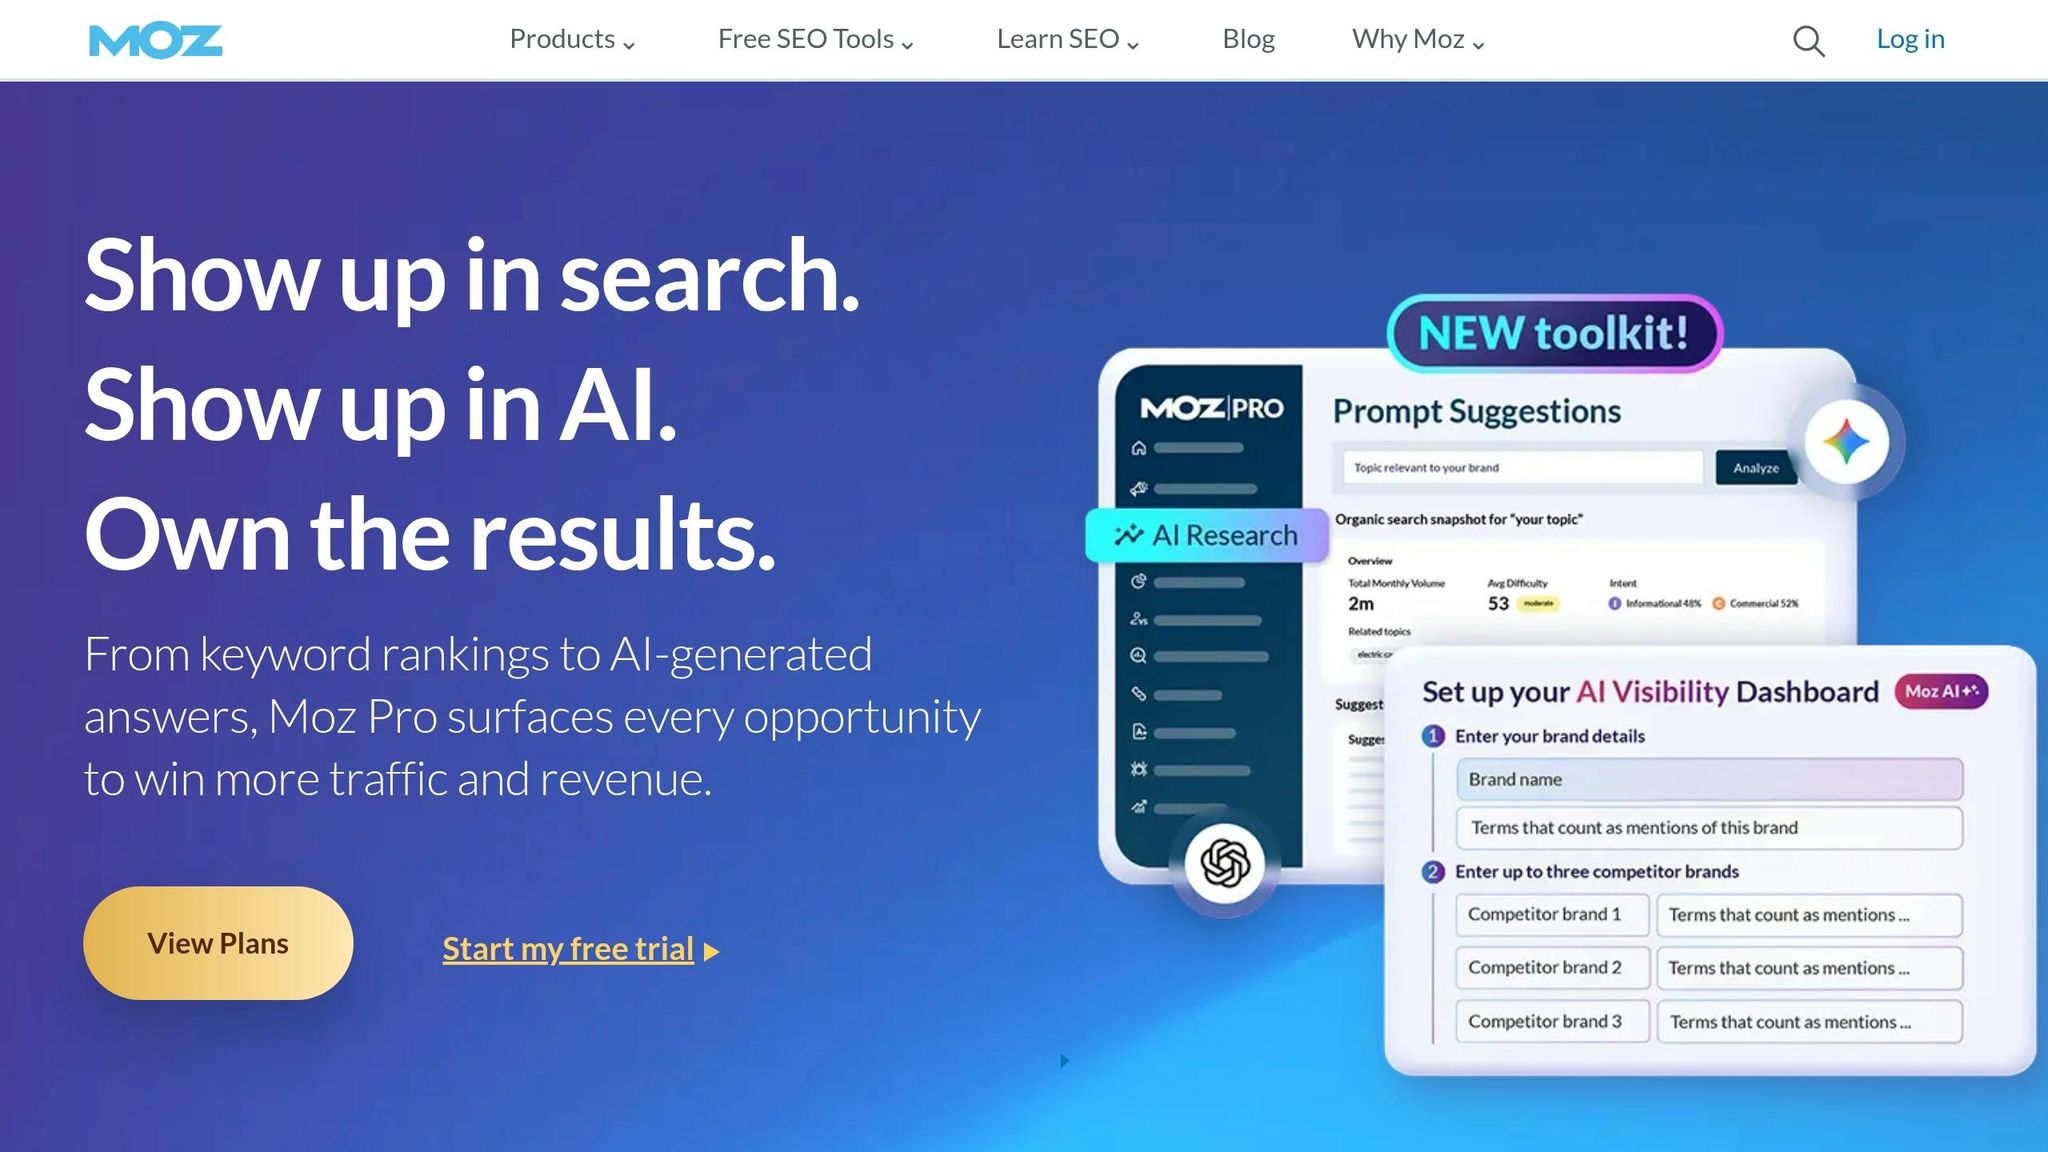
How to Set Up Your Moz AI Visibility Dashboard: Track How You Show Up In AI Responses
sbb-itb-e8c8399
Step 1: Define Your Dashboard Objectives and Scope
This step sets the stage for building a dashboard that provides meaningful insights into AI search visibility metrics. Before diving into tools or gathering data, it’s essential to pinpoint what you want to learn. Without clear objectives, your dashboard risks producing irrelevant or misleading information. Establishing these goals is the first step to show up in AI search results effectively.
Identify Your Use Cases for AI Visibility
B2B tech teams rely on dashboards to address three key areas: spotting content gaps, tracking competitive positioning, and managing brand narrative. Let’s break these down:
- Content gaps occur when AI models answer buyer queries without referencing your brand. This often indicates your site lacks structured, factual content that AI models prioritize.
- Competitive positioning reveals whether you’re gaining or losing ground against competitors in your space.
- Narrative control ensures AI accurately represents your brand – for example, avoiding mischaracterizations like labeling a premium enterprise solution as "budget-friendly."
To get started, create a library of 15–20 query prompts that reflect key buyer searches, such as category-specific, comparison-based, or problem-solving queries [2]. These prompts will serve as the foundation for measuring your performance.
Once your use cases are clear, focus on tailoring your data visualization to meet the needs of your stakeholders.
Map Stakeholders and Their Data Needs
Not every stakeholder needs the same data, and trying to cater to everyone with a single dashboard often leads to confusion. Instead, align your metrics with the priorities of each team. Here’s a quick breakdown:
| Stakeholder | Key Metric | Reporting Cadence |
|---|---|---|
| CMO / Leadership | Overall visibility score, share of voice vs. competitors | Weekly |
| Content Team | Answer gap analysis, citation share by page | Bi-weekly |
| Product Marketing | Sentiment analysis, brand framing/narrative | Monthly |
| Finance | AI-referred traffic, conversion rates, revenue | Monthly |
| SEO / Technical | AI crawler logs, knowledge graph presence | Weekly |
Christian Lehman, Cofounder & Chief Growth Officer at AuthorityTech, emphasizes the importance of specificity in AI visibility dashboards:
"If your AI visibility dashboard cannot show who cited you, where you appeared, and which buyer-stage prompts you own, you do not have an AI visibility program yet. You have a legacy marketing report with a new label." [3]
Once you’ve mapped out stakeholder needs, the next step is to establish a reporting cadence that keeps everyone informed without overwhelming your team.
Set Your Reporting Cadence
Getting the cadence right is crucial. Too frequent, and you drown in noise; too infrequent, and you miss critical trends. Here’s a structure to balance efficiency and insight:
- Weekly: Focus on tactical decisions, such as identifying sudden drops in brand mentions or evaluating the impact of new content [6]. Limit this to your top 5 revenue-driving prompts to keep it manageable [5].
- Monthly: Provide broader updates for stakeholders, including share of voice, sentiment analysis, and prompt coverage. This is also the time for a full audit of your prompt set [5].
- Quarterly: Take a step back to reassess your prompt library, align it with evolving buyer searches, and adjust benchmarks as needed [5].
"Weekly is the standard for active monitoring. Monitor daily if you’re shipping fast and testing. Monthly is too slow for iterative teams." – Omnia [6]
Avoid jumping to conclusions based on less than 30 days of data. While daily tracking can be useful for high-frequency publishing, it often introduces unnecessary noise. Research shows that only 35% of domains appear consistently in AI answers across multiple runs of the same prompt [7], making daily snapshots unreliable for trend analysis.
With clear objectives, tailored stakeholder views, and a thoughtful reporting cadence, you’re ready to move forward with selecting and configuring the tools to power your AI visibility dashboard.
Step 2: Choose and Configure Your AI Visibility Tools
Once you’ve nailed down your objectives, stakeholder map, and reporting schedule, it’s time to pick the right tool and set it up properly. Don’t fall into the trap of choosing tools that are either too complicated or too basic for your needs. A solid start ensures you can effectively track multiple AI models.
What to Look for in an AI Visibility Tracking Tool
The most critical feature to prioritize is multi-model coverage. AI models often differ significantly in their recommendations – in fact, research shows only 43.9% alignment on the top result for the same query [8]. Relying on a tool that tracks just one platform will leave you with an incomplete view.
Beyond that, look for these key features:
- Automated scheduling: This allows you to run queries daily or weekly, capturing changes in AI responses over time without needing to do it manually [8][10].
- Competitive benchmarking: Compare citations side by side to see where competitors are mentioned and you’re not [8][11].
- Source attribution: Pinpoint which sources – like Wikipedia, G2, Reddit, or industry blogs – are driving citations for your brand versus your competitors [8][9].
- Sentiment and framing analysis: Understand not just whether you’re mentioned but how you’re framed. For example, being described as "the best option for enterprise teams" is very different from being called "an expensive alternative" [8][10].
Also, check whether the tool offers historical trend data (30, 60, or 90 days). This feature helps you measure whether your efforts are making a measurable impact over time [8][9].
Set Up Your Brand Profile and Queries
Start by entering your primary brand name, any variations, your official domain, and both direct and indirect competitors (e.g., Wikipedia, Reddit, Quora) [14].
Next, create a prompt library. For most B2B tech companies, 10–20 prompts work well for manual tracking, while automated tools can handle upwards of 50–150 prompts [12][2]. Organize these prompts by intent using the following categories:
| Prompt Category | Example Query for B2B Tech | Strategic Goal |
|---|---|---|
| Branded | "Is [Brand] secure for enterprise use?" | Reputation & trust |
| Category | "Best DevOps orchestration tools 2026" | Share of voice |
| Comparison | "[Brand] vs [Competitor] for startups" | Competitive displacement |
| Problem/How-to | "How to automate SOC2 compliance" | Topical authority |
Since AI responses are inherently inconsistent, run each query at least three times on each platform before drawing any conclusions. Studies show the odds of getting the exact same recommendation list twice are less than 1-in-100 [2].
Configure Prompts and AI Sources
Classify your prompts by buyer stage – Awareness, Consideration, Decision – to quickly identify where your brand performs well and where it needs improvement [12][13]. For maximum revenue impact, focus on bottom-of-funnel prompts, such as direct comparisons or category-best queries [8].
When selecting AI platforms, prioritize ChatGPT, Perplexity, and Google AI Overviews:
- ChatGPT: It has the largest user base.
- Perplexity: It explicitly surfaces source links, making it invaluable for tracking linked citations.
- Google AI Overviews: Integrated into standard search results, it provides critical visibility [1][12].
Once your core setup is stable, consider adding Claude and Gemini, especially if your audience includes enterprise buyers or developers.
Finally, integrate your tool with Google Analytics 4. Look for referral parameters (e.g., ?utm_source=chatgpt.com) to connect AI citations to actual traffic and conversions [13]. This step bridges the gap between visibility metrics and business outcomes, giving leadership and finance teams the data they need. With this integration in place, your dashboard is ready to deliver real-time performance insights.
Step 3: Track the Five Core AI Visibility Metrics
Now that your tools are set up and your prompt library is ready to roll, it’s time to start gathering data. These five metrics transform raw numbers into insights you can actually use, giving your dashboard a clear view of how your brand performs in AI-generated answers – and where you might need to step up.
Citation Frequency
Citation frequency tracks how often your brand is cited as a source across the prompts you’re monitoring. To calculate it, divide the number of prompts where your brand was cited by the total number of prompts, then multiply by 100. Hitting a 25% or higher citation rate is often the goal for top players in any category [5].
It’s crucial to understand the difference between mentions and citations. As Zoe Ashbridge from HubSpot explains:
"Mentions are conversational visibility. Citations are sourced authority." [13]
A mention means your brand name pops up in the text, while a citation links directly to a source URL, which carries much more weight. While both are worth tracking, citations should take priority. To focus on trends rather than one-off results, run each prompt three times per platform as part of your testing setup [5].
Share of Voice
Share of Voice (SOV) measures how often your brand is mentioned compared to others in your category. Divide your brand’s mentions by the total mentions across all queries, then multiply by 100. A 15% or higher share is a solid benchmark for leading brands [2].
SOV becomes even more useful when you break it down by query type. For instance, your brand might dominate "best-of" lists but struggle in direct comparisons or problem-specific searches. Segmenting results in this way reveals where your strengths lie – and where you might be falling short [8]. Keep in mind that different AI platforms may produce varying SOV results due to their unique algorithms.
Prompt Coverage
Prompt coverage measures the percentage of tracked prompts where your brand shows up, whether as a mention or a citation. Think of it as a measure of breadth, complementing the depth you get from citation frequency. To dig deeper, split your prompt library into stages of the buyer journey – Awareness, Consideration, and Decision – and calculate coverage for each stage.
For example, if your brand has strong coverage during the Awareness stage but drops off when it comes to Decision-stage prompts (like "best tool for X"), it’s a sign you might need to refine your strategy to rank in AI search results. Beyond that, analyzing co-citations can help you understand how your brand is being positioned alongside others.
Co-Citation Partners
Co-citation partners reveal which other brands, tools, or topics are mentioned alongside yours in AI responses. This offers insight into how AI models are positioning your brand within your industry. For instance, you might frequently appear alongside niche review sites or industry publishers that aren’t direct competitors but still shape your perceived standing [8].
Review your co-citation list weekly. If you’re consistently grouped with enterprise-level players, that’s a signal to double down on that positioning. On the flip side, if your brand is showing up next to names you don’t want to be associated with, it’s worth investigating the sources influencing that context. Your co-citation map acts as a peek into the AI’s "knowledge graph" for your space [5].
LLM and Surface Distribution
This metric breaks down how your citations are spread across different AI engines and the surfaces where those answers appear. For example, a citation in a ChatGPT conversation, a Perplexity source card, or a Google AI Overview each reflects unique sourcing and audience behavior.
| AI Platform | Primary Source Preference | Strategic Focus |
|---|---|---|
| ChatGPT | Wikipedia, Reddit, high-authority blogs | Content depth and authority |
| Perplexity | Reddit, news sources, real-time web | Community presence and PR |
| Google AIO | Top-ranking SERP pages, YouTube | Traditional SEO and technical health |
| Claude | Technical documentation, research papers | Expert-led, factual content |
For example, strong visibility in ChatGPT but a weak presence in Google AI Overviews could point to gaps in your SEO strategy. (As of 2026, Google AI Overviews appear in about 50% of all Google searches [15].) Check this distribution weekly to catch platform-specific dips before they snowball. Segment AI referral traffic by source domain (e.g., chatgpt.com or perplexity.ai) to connect each platform’s citations to actual site visits and conversions [13]. By tracking these patterns, you’ll ensure your AI visibility dashboard reflects reality and helps fine-tune your strategy.
Step 4: Build and Maintain Your AI Visibility Dashboard
Design a Simple Dashboard Layout
Keep your dashboard straightforward for easy interpretation. A three-layer structure works best: a summary panel at the top, trend charts in the middle, and detailed data tables at the bottom [16][5].
The summary panel should highlight key metrics like citation rate, share of voice, and prompt coverage. In the middle, use trend charts to show how these metrics evolve over time. At the bottom, include detailed data tables to drill down into specifics, such as which queries featured your brand, which AI engines surfaced your content, and whether you received a mention or a full citation.
One critical feature is an evidence log – a collection of screenshots or snapshots of AI-generated answers. This log is crucial for audits and ensures your brand is being represented as intended [16]. Organize your data by intent categories (e.g., commercial, informational, transactional, brand-defensive) so teams like content, SEO, and demand generation can easily access the insights they need without unnecessary clutter [17].
Once your layout is ready, schedule regular updates to keep your dashboard accurate and actionable.
Schedule Data Collection and Refresh Cycles
After finalizing your dashboard layout, establish a routine for gathering and refreshing data. Consistency is more important than how often you collect the data. For most scenarios, a weekly update is the sweet spot – it balances capturing meaningful trends without overwhelming your team [6][12]. If you’re producing content at a rapid pace, daily updates might be better, but for everyone else, weekly works just fine.
Standardize your date format to MM/DD/YYYY across all data sources. This avoids merging issues when tools like Looker Studio or other BI platforms consolidate your data [4]. To account for the variability in AI responses, run consistent tests across engines to stabilize citation probabilities [17]. Store all results in a centralized system, such as a Google Sheet, BigQuery table, or native dashboard connector, and set up automated email delivery so stakeholders receive regular PDF snapshots without needing to log in [4].
"If you’ve spent a single dollar on Generative Engine Optimization… and you can’t answer ‘is it working?’ with a number, you’re flying blind." – Lorne Fade, Founder, Fade Digital [5]
Read Metric Shifts and Act on Them
Once your metrics are in place, focus on spotting sustained changes rather than reacting to one-off fluctuations. For example, a three-week downward trend signals a need for action [5][6]. When you notice a shift, start by identifying why it happened before making adjustments.
Visibility drops typically fall into one of three categories:
- Content gap: You lack a page that answers the specific query being asked.
- Authority gap: Your content exists, but AI models favor third-party sources over yours.
- Clarity gap: Your content isn’t structured in a way the AI can easily understand – for example, missing schema, overly dense text, or unclear formatting [6].
Set up automated alerts to catch critical changes. For instance, a share of voice drop of more than 20% week-over-week or a top prompt’s citation rate falling below 20% should prompt immediate investigation [17]. Use server logs to track AI crawler activity. If bots like GPTBot or ClaudeBot aren’t visiting your key pages, they won’t cite them – and that’s a technical issue to resolve before tweaking the content [1][12]. Finally, refresh your full prompt set every 90 days to stay aligned with how buyers are phrasing their questions [17][5].
Conclusion: Key Takeaways and Next Steps
Now that you’ve got the framework for building an AI search visibility dashboard, it’s time to solidify your AI search ranking optimization strategy. This process involves selecting the right metrics, configuring your tools, tracking changes, and responding quickly. Each of the five key metrics brings a unique perspective, and together they give you a comprehensive view of your brand’s presence in AI-generated responses.
One-off results don’t tell the full story. Research highlights that only 20% of brands maintain visibility across five consecutive AI runs [16]. That’s why it’s smarter to measure visibility as a percentage-of-runs rather than relying on a single yes-or-no snapshot.
As your process evolves, let your reporting cadence guide ongoing improvements. The table below provides a structured review cycle to help refine your dashboard over time:
| Cadence | Focus Metrics | Primary Action |
|---|---|---|
| Weekly | Mention Rate, Citation Frequency, Crawler Activity | Implement 2–3 quick updates to existing content |
| Monthly | Share of Voice, Prompt Coverage, Sentiment | Identify content gaps and benchmark competitors |
| Quarterly | Prompt List Audit, Branded Search Lift | Retire outdated prompts and align with business goals |
This structured approach ensures your dashboard stays relevant and actionable.
Begin with 25–50 high-intent prompts and expand your list as needed. If a trend emerges over three consecutive weeks, act immediately to capitalize on it.
"AI visibility on its own is a vanity metric… a raw ‘you were mentioned 40 times this week’ number tells you almost nothing without context." – Wil Reynolds, Founder, Seer Interactive [1]
The brands that excel in AI search rely on tight feedback loops. Keep monitoring, adjusting, and iterating – this cycle is the foundation of success in AI search visibility.
FAQs
What’s the fastest way to pick my first 25–50 prompts?
To get started with your first 25–50 prompts, focus on aligning them with buyer intent and category relevance. Begin by crafting 15–25 prompts in key areas such as recommendations, comparisons, and problem-solving. Test these prompts on AI platforms and monitor their performance, either manually or through automation. Pay attention to metrics like mentions, citation rates, and share of voice to gauge effectiveness.
Start small by running 10–20 prompts manually. Once you’ve established a rhythm, scale up gradually while reviewing results weekly to identify any shifts or gaps in your strategy.
How do I tie AI visibility to revenue in GA4?
To tie AI visibility directly to revenue in GA4, you’ll need to set up an attribution layer that links AI-driven traffic to conversions or revenue. Start by building custom segments for AI referrers such as chatgpt.com and bing.com. Use UTM parameters to improve tracking precision, ensuring you can clearly identify traffic sources. Next, integrate GA4 with your conversion data to capture the full picture. Applying custom attribution models will help you better allocate revenue to these AI-driven sources. Finally, make it a habit to regularly review your reports to assess the impact of AI traffic on your revenue.
What should I do if my AI citations drop for 3 weeks?
A noticeable 3-week decline in AI citations points to a trend worth addressing. Begin by pinpointing the prompts or queries that have seen a drop in citations. Compare these to what competitors are doing – are they ranking higher for similar queries? Evaluate whether the problem lies in structural elements like schema or tags, or if it’s tied to the content itself. Once you’ve identified the most pressing gaps, take action to update and refine. After implementing changes, test the same prompts again in 1-2 weeks to see if the adjustments drive recovery. Regular updates and vigilant tracking will be essential to turning this trend around.
Related Blog Posts
- AI Brand Visibility: How To Optimize Your Brand’s Visibility in AI Search
- Show Up in AI Search Results in <2 Weeks: Step-by-Step Guide (2026)
- AI Search Analytics: The Metrics + Dashboard You Need to Track LLM Visibility
- AI Search Visibility Tools & Metrics: What to Buy (and the Metrics That Actually Matter)