

Think your sales team is on track? Here are the 3 metrics that actually tell you:
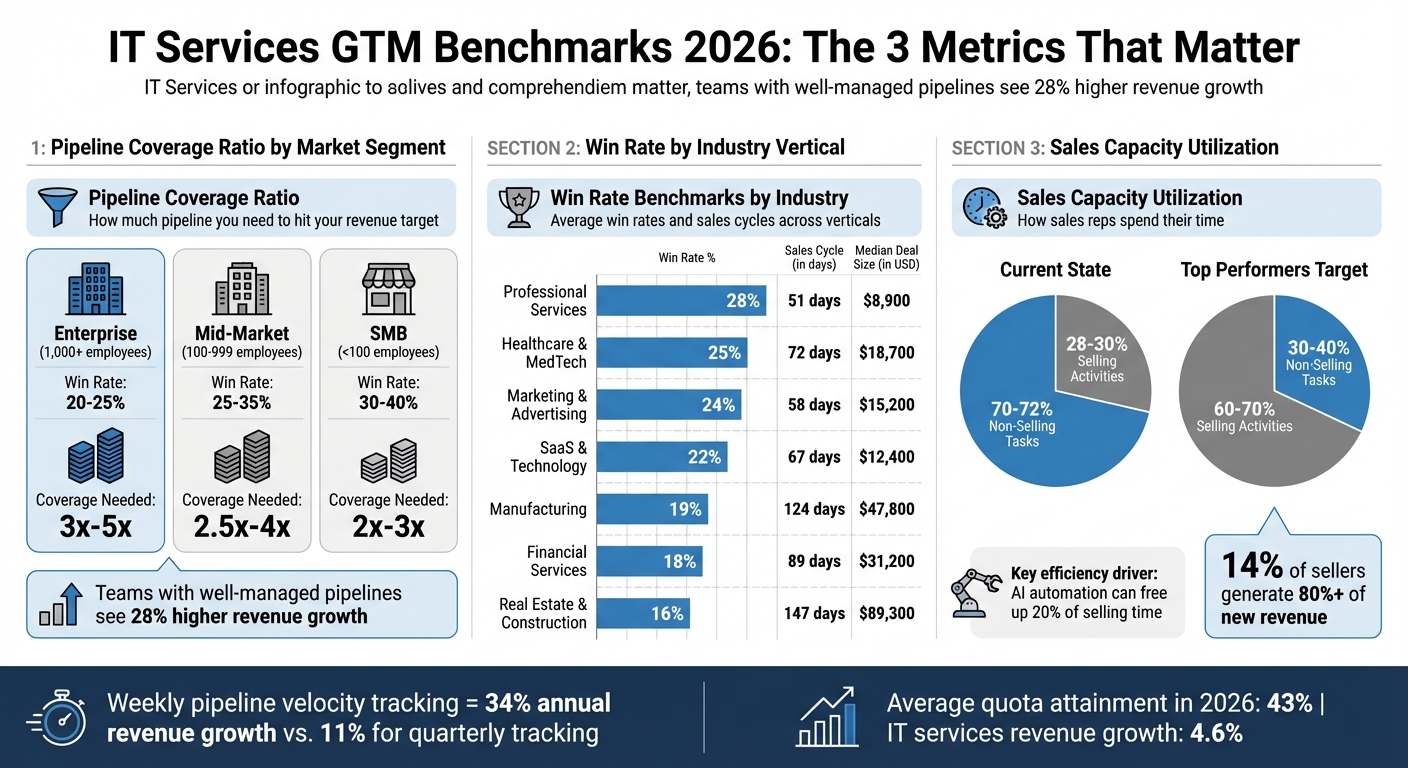
- Pipeline Coverage Ratio: Do you have enough opportunities to hit your revenue target? The sweet spot is 3x–5x your goal, depending on your win rate. Too low? You’re at risk. Too high? You might be stuck with dead deals.
- Win Rate by Vertical: Industry matters. Professional Services firms close 28% of deals, but Manufacturing struggles at 19%. Tailoring your approach by vertical can drive better results.
- Sales Capacity Utilization: Most reps spend only 28–30% of their time selling. High-performing teams aim for 60–70% by automating admin tasks and focusing on high-value activities.
Why this matters: Average quota attainment is just 43% in 2026, and IT services revenue growth has slowed to 4.6%. Tracking these metrics is the difference between growth and stagnation.
Key takeaway: Weekly tracking of sales velocity (pipeline size, win rate, and cycle length) leads to 34% annual revenue growth. Want to improve? Focus on better qualification, faster follow-ups, and AI-driven tools to free up selling time.
IT Services Sales Benchmarks 2026: Pipeline Coverage, Win Rates & Sales Capacity by Industry
Pipeline Coverage Ratio Benchmarks for 2026
What Pipeline Coverage Ratio Means and Why It Matters
The pipeline coverage ratio measures the total dollar value of your sales funnel against your revenue target for a specific period [7]. For instance, if your quarterly goal is $500,000 and your pipeline holds $1,500,000 in opportunities, your coverage ratio would be 3x. This metric helps assess whether you have enough opportunities to realistically meet your targets.
This ratio acts as a diagnostic tool. A coverage ratio below 2x could indicate weak lead generation or poor qualification processes, while a ratio above 5x might suggest your pipeline is bloated with stale “zombie deals” that aren’t likely to close [7]. The ideal ratio depends on your historical win rate. For example, if your team closes 25% of deals, you’d need at least 4x coverage to meet your targets [7].
Using weighted coverage offers a more accurate forecast. This method assigns probabilities to each deal based on its stage or AI-driven predictions, ensuring you don’t treat every opportunity as a guaranteed win. Many forecasts fail because they overlook this nuance [7].
2026 Benchmarks by Company Size and Growth Stage
Pipeline coverage requirements vary depending on company size and the complexity of the sales process. For example, enterprise IT services firms typically require 3x to 5x coverage due to longer sales cycles and buying committees that now average 7.2 stakeholders [7][10]. Mid-market B2B teams aim for 2.5x to 4x coverage, while SMB sales, which tend to move faster, can operate effectively with 2x to 3x coverage [7].
| Market Segment | Typical Win Rate | Target Pipeline Coverage |
|---|---|---|
| Enterprise (1,000+ employees) | 20-25% | 3x – 5x |
| Mid-Market (100-999 employees) | 25-35% | 2.5x – 4x |
| SMB (< 100 employees) | 30-40% | 2x – 3x |
Source: Data from Outreach and Forecastio, 2025-2026 [7][1].
As company size increases, win rates tend to decrease. For example, companies with $1 million to $5 million in revenue average a 26% win rate, while those exceeding $500 million drop to 17% [2]. Actively managing and refining your pipeline can make a big difference – teams with well-maintained pipelines see 28% higher year-over-year revenue growth [9].
How to Improve Pipeline Coverage
Generic rules don’t work for everyone. To determine your specific coverage needs, divide 1 by your historical win rate [7]. For instance, if you close 20% of your deals, you’ll need 5x coverage to hit your quota. It’s also smart to track coverage separately by territory, rep, and deal type, as enterprise deals often demand more buffer than smaller, transactional ones [7].
Adopting a robust qualification framework like MEDDPICC (Metrics, Economic buyer, Decision criteria) can help ensure your pipeline only includes high-quality opportunities [8]. Regularly clean up your pipeline by removing deals that have been inactive for 45 to 60 days to avoid inflating your coverage with unlikely prospects [7]. AI-powered tools now make this process easier by automatically flagging stale deals, saving valuable time [8][7].
“Sales leaders should maintain a 3:1 pipeline-to-quota ratio. Teams with accurate, actively managed pipelines see 28% more revenue growth year over year.” – Martal Group [9]
Tracking sales velocity weekly instead of quarterly can also have a big impact. Companies that do this achieve 34% annual revenue growth, compared to just 11% for those with less frequent reviews [2]. This disciplined approach to pipeline management lays the groundwork for exploring win rate benchmarks by industry in the next section.
Win Rate Benchmarks by Industry Vertical in 2026
What Win Rate Means and Why It Matters
Win rate measures the percentage of decision-stage opportunities that turn into closed-won deals. For example, if your team closes 15 deals out of 50 opportunities, your win rate is 30%. This differs from close rate, which accounts for all opportunities in the pipeline – not just those in the decision stage [1].
This metric provides a clear picture of how efficiently your sales process operates, how skilled your team is, and how well your company stacks up against competitors [1]. A high win rate shows that your team is excelling at qualifying leads, addressing customer needs, and standing out in the marketplace. With this foundation, we can dive into how win rates vary by industry.
2026 Win Rate Benchmarks by Industry Vertical
Building on the discussion of pipeline coverage, refining win rates by industry is a key step in strengthening your go-to-market strategy. Win rates differ widely across industries due to factors like buying complexity, decision-maker involvement, and competition. According to 2026 data, Professional Services leads the pack with a 28% win rate, followed by Healthcare & MedTech at 25%, and Marketing & Advertising at 24% [2]. IT services firms working with SaaS & Technology clients average a 22% win rate, while Manufacturing trails at 19% [2].
| Industry Vertical | Average Win Rate | Median Deal Size | Typical Sales Cycle |
|---|---|---|---|
| Professional Services | 28% | $8,900 | 51 days |
| Healthcare & MedTech | 25% | $18,700 | 72 days |
| Marketing & Advertising | 24% | $15,200 | 58 days |
| SaaS & Technology | 22% | $12,400 | 67 days |
| Manufacturing | 19% | $47,800 | 124 days |
| Financial Services | 18% | $31,200 | 89 days |
| Real Estate & Construction | 16% | $89,300 | 147 days |
Source: First Page Sage 2026 Report [2].
These variations highlight the challenges in each industry. Take Healthcare, for example: navigating HIPAA compliance and securing approvals from multiple departments can slow down the process, even when the product is a great fit [1].
Deal size also plays a role in win rates. Smaller deals under $50,000 convert at higher rates (35-45%), while larger deals over $100,000 typically see lower conversion rates of 15-25% [1]. This explains why Real Estate & Construction, despite having the lowest win rate at 16%, still achieves strong daily sales velocity thanks to a median deal size of $89,300 [2].
How to Improve Win Rates by Vertical
Knowing these benchmarks allows you to fine-tune strategies for each industry. Early involvement of all key decision-makers can significantly improve outcomes. For enterprise deals, engaging three or more stakeholders can increase win rates by up to 3.1x [13]. For IT services, this means identifying decision-makers – such as technical leads, procurement teams, and executives – within the first two discovery calls [1].
Timely follow-ups are equally crucial. Responding to inquiries within 4 hours can boost close rates by 35% [1]. Tools like CRM systems can help track and ensure rapid follow-ups, improving your chances of success [1]. Additionally, incorporating technical validation calls early in the sales process can double win rates for complex IT services deals [1].
Tailoring your approach to each industry is essential. Use sector-specific case studies and ROI metrics to build trust and credibility [12]. For instance, when targeting Healthcare, emphasize HIPAA compliance success stories and patient data security benefits. For Manufacturing, focus on how your solution improves operational efficiency and reduces downtime. Companies with strong collaboration between their sales and marketing teams see 38% higher win rates, as their messaging aligns more effectively with the specific challenges of each vertical [14].
Sales Capacity Utilization Benchmarks for IT Services
What Sales Capacity Utilization Means
Sales capacity utilization measures how much time sales professionals spend on high-value activities, such as discovery calls, building relationships, and closing deals, versus low-value tasks like administrative work. On average, sales reps dedicate only 28%–30% of their week to selling, leaving a staggering 70% for non-selling tasks [16].
This imbalance has a direct impact on revenue. When too much time is spent on low-value activities, deal cycles slow, sales momentum weakens, and revenue takes a hit. Interestingly, just 14% of sellers generate over 80% of new revenue [11]. These top performers manage 164% more deals than their peers by prioritizing efficiency and focusing on relationship-driven activities [11].
2026 Benchmarks by Sales Role
Recent data reveals noticeable differences in how sales roles allocate their time. High-performing IT services sales teams aim to spend 60–70% of their time on core sales activities, a goal made achievable through automation and process improvements [16]. The adoption of full-cycle sales models, where one seller handles the entire customer journey from prospecting to closing, is also on the rise. In fact, 46% of businesses are now using this approach to reduce handoff delays and friction [11].
| Sales Role | Current Time Spent Selling | Target Time for Selling (Top Performers) | Key Efficiency Driver |
|---|---|---|---|
| Account Executive (AE) | 28–30% [16] | 60–70% | AI-powered pipeline audits and automated discovery [11] |
| Business Development (BDR/SDR) | 28–30% [16] | 60–70% | Automated lead qualification and sequence management [11] |
| Solution Architect | Varies by firm | 50–60% | CPQ tools and guided selling platforms [15] |
Automation is a game-changer here. For instance, 81% of businesses now use AI for pipeline generation, and 91% prioritize automation to cut inefficiencies [11]. Companies leveraging Configure, Price, Quote (CPQ) software can send proposals within one hour 95% of the time, compared to just 56% for those without it [15].
With these benchmarks in mind, the next step is implementing strategies to free up more selling time.
How to Increase Sales Capacity Utilization
Improving sales capacity utilization is essential for strengthening your overall go-to-market (GTM) strategy. By automating repetitive tasks, you can reclaim valuable selling time. For example, AI-powered tools for lead routing, data entry, and meeting summaries can free up as much as 20% of selling time [16]. However, 86% of companies still lack Contract Lifecycle Management (CLM) software, leaving sales reps to manually update CRMs and track contract versions, which eats into their productivity [15].
Streamlining your quote and proposal processes also yields quick wins. Consider this: 84% of small and medium-sized businesses (SMBs) using CPQ software can generate a quote in under 30 minutes, compared to just 57% of those without it [15]. For enterprise-level deals, only 32% of firms with CPQ can send proposals in under 30 minutes, versus a mere 7% without [15].
Another way to optimize utilization is by focusing on high-intent leads. AI-driven lead scoring helps sales reps concentrate on prospects with the highest likelihood of converting [16]. Companies using AI tools report a 33% boost in overall efficiency, and 76% of sales reps say automation reduces stress by eliminating tedious administrative work [16].
sbb-itb-e8c8399
Which Metrics ACTUALLY Matter for B2B Marketers with Ray Rike – Ep 22
How Data-Mania Helps IT Services Firms Optimize GTM Performance
Data-Mania‘s Fractional CMO services offer tailored solutions to tackle key challenges in go-to-market (GTM) strategies. By focusing on pipeline coverage, win rates, and sales capacity, their approach zeroes in on the specific bottlenecks IT services firms face. Let’s break it down.
AI-Powered Pipeline Audits
Data-Mania’s audit framework digs deep into nine critical metrics, such as visitor-to-lead conversion, MQL-to-SQL conversion, win rates, and pipeline velocity. These metrics are compared against industry benchmarks for 2025-2026 [6]. One standout finding? The MQL-to-SQL conversion stage is often the weakest link, with average rates between 15% and 21% [6]. Even a modest improvement of 5 percentage points at this stage can boost total revenue by as much as 18% [6].
The audit doesn’t just stop at identifying gaps – it quantifies them. For example, if your visitor-to-lead conversion rate is 0.9%, but the B2B SaaS benchmark sits at 1.4%, you’ll know exactly where potential leads are slipping away [6]. The “north-star” metric here is pipeline velocity, which combines deal value, win rate, and sales cycle efficiency into a single measurement. Firms that track this weekly experience 34% annual revenue growth and 87% forecast accuracy, compared to just 11% growth and 52% accuracy for less consistent trackers [6][2]. As Vlad Kuryatnik, Fractional CMO, puts it:
“In audits, pipeline velocity is your single most useful ‘north-star’ metric – it captures efficiency, deal value, and win rate in one formula.” [6]
Another key metric is the Revenue Leak Rate (RLR), which highlights losses due to preventable issues like unworked leads, stalled deals, and single-threaded opportunities. These leaks can account for 19% of inbound leads, 31% of deals at compliance, and 26% due to single-threaded deals [17].
Custom Sales Strategy Development by Vertical
Data-Mania’s vertical-specific strategies focus on creating “sales plays” tailored to high-yield personas. By segmenting data by industry and company size (SMB, mid-market, and enterprise), they address the 50%+ variation in conversion rates caused by these factors [6]. For instance, Professional Services firms typically aim for a 28% win rate with a 51-day sales cycle, while Financial Services firms average 18% win rates over 89 days [2].
These strategies also include using a Multithreaded Deal Ratio (MDR) to ensure at least 3 active contacts – including economic buyers, technical buyers, and champions – are involved in mid-market and enterprise deals [17]. This aligns with the average of 7.2 stakeholders in modern B2B purchases [10]. Additionally, Service Level Agreements (SLAs) are introduced, such as a mandatory 24-hour follow-up for marketing-qualified leads [18].
When win rates fall 5 points below industry benchmarks, Data-Mania shifts the focus to tightening qualification processes or strengthening ROI proof in late-stage proposals [6]. For firms with late-stage deals dragging beyond two months, win rates can drop by 113%, making velocity management a top priority [11].
Sales Capacity Assessment and Optimization
To measure and improve sales capacity, Data-Mania uses the AI Utilization Score (AUS). This metric tracks how AI-augmented sales reps handle 2-3x the pipeline volume compared to non-AI reps [17]. The assessment identifies inefficiencies, like time spent on low-value tasks, and redirects focus to high-impact activities such as discovery calls and closing deals.
One practical tool is adding a “velocity row” to CRM dashboards. This calculates (Opportunities × Deal Size × Win Rate) ÷ Sales Cycle Days on a weekly basis. If this metric drops by more than 10% month-over-month, it signals deal slippage or approval bottlenecks [6]. For firms without Contract Lifecycle Management (CLM) software – an issue affecting 86% of companies [15] – automation tools are prioritized to free up as much as 20% of selling time [16].
Other optimizations include pre-recorded demos and pricing calculators, which can cut enterprise sales cycles by 17% while preserving contract value [6]. By addressing these sales capacity issues, Data-Mania helps IT services firms turn benchmarks into actionable strategies for consistent revenue growth.
Key Takeaways for IT Services Firms
For mid-market IT services firms, maintaining a pipeline coverage of 3x to 4x is essential, while enterprise deals demand even more – 4x to 6x coverage [4][5]. Win rates differ significantly by industry, with Professional Services firms averaging 28%, Healthcare at 25%, and Financial Services trailing at 18% [2]. These numbers highlight the importance of tailoring strategies to specific verticals.
Sales capacity utilization is another area ripe for improvement. Surprisingly, only 14% of sellers contribute over 80% of new revenue [11]. Firms that track pipeline velocity weekly – factoring in deal value, win rate, and sales cycle length – report impressive results: 34% annual revenue growth and 87% forecast accuracy. In contrast, companies that monitor inconsistently see just 11% growth and 52% accuracy [2].
The shift toward AI-driven tools is no longer optional. Manual prospecting is becoming outdated, with companies like LivePerson leading the way. By using AI-powered tools, LivePerson cut prospect research time from 20 minutes to just 2 minutes, boosting engagement rates by 35%. Similarly, Pushpay achieved a 62% improvement in win rates and exceeded quotas by 179% after implementing continuous AI coaching [3]. These examples underline the competitive edge that data-driven strategies provide.
Data also reveals key behaviors that drive success. Multi-threading deals across multiple departments increases win rates by 56%. Additionally, deals closed within 50 days maintain a 47% win rate, compared to just 20% for those that drag on longer [3]. Armed with these insights, Data-Mania’s Fractional CMO services help IT services firms translate benchmarks into action through AI-powered pipeline audits, industry-specific sales strategies, and optimized sales capacity.
FAQs
What are the best strategies for IT services firms to improve their pipeline coverage ratio and drive consistent revenue growth?
To boost your pipeline coverage ratio and drive revenue growth, start by ensuring your pipeline data is accurate and up-to-date. Calculate this ratio by dividing the total value of qualified opportunities by your revenue target – a 3:1 ratio is often a solid benchmark. Regularly clean up your CRM to eliminate outdated or unrealistic deals, and make sure every opportunity includes clear close dates, stages, and probabilities. This ensures your focus stays on deals that genuinely contribute to your revenue goals.
It’s essential to align sales and marketing teams around a shared Ideal Customer Profile (ICP) so only high-quality leads make it into the pipeline. Leverage AI-driven tools to score leads and prioritize those with the highest potential. Regularly assess pipeline health by breaking it down into segments like industry verticals or deal sizes. From there, reallocate resources toward opportunities with better closing potential to help shorten the sales cycle.
Maintaining strong pipeline hygiene is equally important. Conduct regular reviews, update forecasts, and address deals that may be at risk. A good rule of thumb is to aim for 70-80% of your team’s time to be spent on active, qualified opportunities. Use automation and predictive analytics to quickly identify promising deals, and adjust your target coverage ratio based on win-rate patterns across different verticals. By keeping your pipeline focused and aligned with your team’s capacity, you can create a predictable and steady path to revenue growth.
What are the best strategies to improve win rates across industry verticals?
To boost win rates across different industry verticals, start by diving into your sales data using a consistent win-rate formula. Break this data into categories like deal size, individual sales reps, and specific market segments. This will help you pinpoint where your team excels and where there’s room to improve. Pay special attention to high-intent accounts, make the most of partner referrals, and grow revenue from your current customers by focusing on upselling and cross-selling opportunities. Leveraging AI tools can also help by connecting the right deals with the right sellers, while aligning sales and marketing efforts ensures a smoother process overall.
Adapt your strategy to the buying behaviors of each vertical. For instance, in financial services, compliance might be a top priority, whereas manufacturing clients may care most about ROI. Strengthen critical sales skills like lead qualification, handling objections, and building strong relationships to foster trust and provide a more tailored buying experience. Make it a habit to track performance, set clear benchmarks, and review outcomes with your team regularly. This ongoing process will help you fine-tune and scale your strategies for long-term success.
How can sales teams improve their sales capacity utilization to boost performance?
Sales capacity utilization measures how much of a salesperson’s time is dedicated to revenue-driving activities – like prospecting, selling, and closing deals – versus time spent on non-selling tasks. Improving this metric allows sales teams to manage more opportunities without increasing headcount, ultimately enhancing overall performance.
To raise utilization rates, start by automating repetitive tasks and simplifying administrative work. For instance, AI-powered tools can cut down on time spent on data entry and other routine activities, giving sales reps more time to focus on selling. Additionally, maintaining a strong pipeline coverage – ideally 3 to 4 times the quota – ensures a steady flow of qualified opportunities, reducing downtime for sales teams.
Another key approach is improving win rates. This can be achieved by sharpening deal qualification processes, segmenting opportunities by size, and offering tailored coaching. Aligning sales and marketing efforts and relying on data-driven capacity planning ensures resources are allocated effectively to meet pipeline demands. Regular audits of sales activities, combined with shifting low-value tasks to support roles, can further streamline operations and deliver better results.


