

AI businesses often struggle with tracking the right metrics because traditional SaaS tools don’t account for AI’s unique cost dynamics. Here’s the key takeaway: your pricing model should dictate the metrics you measure. Whether you’re using seat-based, consumption-based, or hybrid pricing, aligning your metrics with your revenue model is crucial to avoid misleading data and improve decision-making.
Key Points:
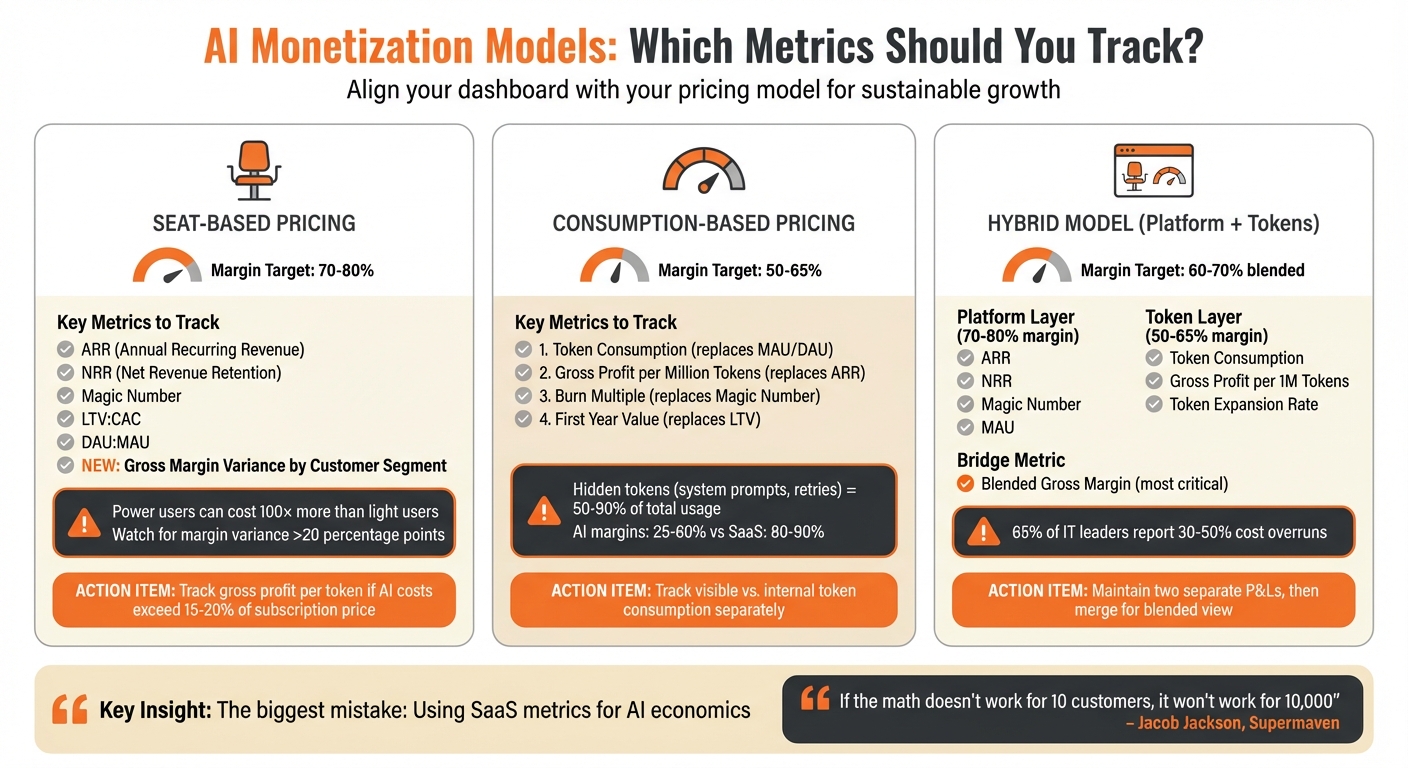
- Seat-Based Pricing: SaaS metrics like ARR and NRR still work but watch for margin drops from AI inference costs. Track gross margin variance by customer segment.
- Consumption-Based Pricing: ARR and Magic Number lose relevance. Focus on token consumption, gross profit per million tokens, burn multiple, and first-year value.
- Hybrid Models: Treat platform fees and token usage as separate businesses. Use blended gross margin to unify insights.
The hard part is recognizing when traditional SaaS metrics fail. For example, ARR can mask profitability issues if high-cost users aren’t segmented. To fix this, track metrics that reflect your actual cost structure and revenue streams.
Why It Matters:
AI companies face tighter margins (40% vs. SaaS’s 90%) and unpredictable costs. Misaligned metrics can lead to scaling unsustainable models. The solution? Tailor your dashboard to your pricing model and report on each layer individually. This ensures you’re focusing on sustainable growth, not just top-line numbers.
AI Pricing Models: Key Metrics Comparison for SaaS Companies
Seat-Based Pricing: Your Existing Metrics Still Mostly Work
Standard SaaS Metrics Still Apply
For seat-based models with high margins – typically around 80–90% – and mostly fixed costs, established SaaS metrics like ARR, NRR, Magic Number, LTV:CAC, and DAU:MAU continue to hold up well [3]. This stability comes from the negligible marginal costs per user, which makes it easier for buyers to plan budgets and for finance teams to create accurate forecasts. For horizontal tools like CRMs or help desks, the value aligns naturally with headcount. These models remain practical as long as per-user inference costs stay under 15–20% of the subscription price [1].
When AI Features Break Your Margin Assumptions
The introduction of AI features with hefty inference costs can upset the standard margin structure, making ARR less reliable as a quality signal. For AI-native companies, gross margins can plummet from the standard 80–90% range to somewhere between 25% and 60% because of these added costs [3].
Another challenge is usage asymmetry. A power user can generate up to 100× the compute cost of a light user, creating a wide gap in per-user expenses. For example, a typical user might cost $2.50 to serve, yielding a 91% margin on a $30/month seat. But a heavy user running complex AI workflows could rack up $45 in compute costs, turning that into a -50% margin [4]. When margin variance exceeds 20 percentage points, ARR loses its reliability as a performance indicator.
How to Audit Your Margins by Customer Segment
To get an accurate picture, track gross margin at the workload or customer segment level rather than relying on aggregate data. Begin by pinpointing all variable costs, including:
- Inference costs (input/output tokens)
- Infrastructure overhead (hosting, monitoring, logging)
- Third-party API costs, such as vector databases or search calls [3]
Don’t forget to account for internal consumption – things like system prompts, reasoning steps, agent loops, and retries – which can make up 50–90% of total usage [3].
If your analysis shows margin variance under 10 percentage points, your current dashboard is sufficient. However, if it exceeds 20 points, you’ll need to incorporate gross profit per token metrics [1]. Focus on identifying the top 10% of customers by their AI cost-to-revenue ratio. Often, these power users consume 8–12 times the median usage [1]. If their API usage costs more than their subscription fee covers, you’ll need to introduce hard caps or usage-based limits to your seat-based model [4].
Once you’ve mapped out margin discrepancies, shift your attention to consumption metrics if necessary to address these imbalances effectively.
sbb-itb-e8c8399
AI Breaks SaaS Gross Margins (90% vs 50%)
Pure Token/Consumption Pricing: Track These 4 Metrics Instead
Switching from seat-based pricing to token-based pricing changes the game entirely. With AI, every single inference call comes with a cost, making traditional SaaS metrics like ARR and Magic Number less relevant. To truly understand the economics of token-based pricing, you need to focus on four specific metrics.
Token Consumption (Replaces MAU/DAU)
This metric tracks the actual volume of language computation, going far beyond simple login counts. It reveals how much users are engaging with your product in terms of tokens consumed. But here’s the catch: token usage isn’t always what it seems. For instance, while a user might visibly trigger 200–300 tokens, internal processes like system prompts, reasoning steps, and retries can multiply that number by up to 10 times. In agentic AI products, these "hidden" tokens can make up 50% to 90% of total consumption [3].
To get a full picture, track visible token usage separately from what’s happening behind the scenes. High token consumption is a good sign only if it’s paired with strong gross profit per token. If profit per token is low, it points to inefficiencies rather than growth potential.
Next, dive into gross profit per million tokens to see how value stacks up against costs.
Gross Profit per Million Tokens (Replaces ARR)
This is your go-to metric for understanding profitability. Calculate it by subtracting your fully loaded COGS (cost of goods sold) from the revenue earned per million tokens. Make sure to include everything in your COGS: inference costs, the "hidden" token iceberg, infrastructure overhead (typically 10–15% of inference costs), and third-party API expenses like vector database queries [3].
"When you receive $10 from the customer, you can’t just spend 10 cents on AWS. You might be spending $4 or maybe $5 just to service that one customer." – Jacob Jackson, Founder, Super Maven [2]
Gross profit per token is a real-time indicator of whether you’re delivering value above your costs [1]. Fast-growing AI startups are currently operating at about 25% gross margins, while more stable ones reach 60%. Compare that to traditional SaaS margins of 80–90% [3]. Without keeping an eye on this metric, you risk scaling revenue while sinking into negative unit economics [2].
Once you’ve nailed down your margins, assess the overall cost of growth using burn multiple.
Burn Multiple (Replaces Magic Number)
Burn multiple measures the total cost of growth, factoring in inference, infrastructure, and support – not just sales and marketing. Unlike the traditional Magic Number, which assumes near-zero marginal costs, burn multiple reflects the reality of AI, where compute expenses dominate [1][3].
The good news? Inference costs have dropped dramatically – GPT-4–equivalent models now cost about $0.40 per million tokens, down from $20 just three years ago [1]. This deflationary trend means your burn multiple might shift even if your sales spending doesn’t. Reassess this metric annually to ensure your pricing aligns with these changes. Also, track contribution margin per 1,000 tokens at the workload level to spot if high-usage customers are eating into your efficiency [1].
Finally, look at first year value to gauge short-term customer profitability.
First Year Value (Replaces LTV)
Lifetime value projections lose their reliability in a consumption model, where usage patterns and AI capabilities evolve rapidly. Instead, focus on first year gross profit – the actual profit generated by a customer in their first year. This metric is especially critical as AI companies approach the "2026 renewal cliff." Many early AI contracts were signed with innovation budgets and low price sensitivity, but as these contracts come up for renewal, CFOs will demand clear ROI and sustainable unit economics [2].
First year value helps you determine if your current customer base can withstand that scrutiny without relying on overly optimistic long-term forecasts.
| Metric | What It Measures | Problem Signal |
|---|---|---|
| Token Consumption | Volume of language computation performed | High usage with low gross profit per token |
| Gross Profit per Million Tokens | Value created above delivery costs | Margins below 50% or shrinking over time |
| Burn Multiple | Total capital consumed per dollar of revenue | Rising burn despite stable sales efficiency |
| First Year Value | Gross profit in first 12 months | Negative or declining cohort economics |
Hybrid Platform + Tokens: Two Dashboards and One Bridge Metric
When working with a hybrid model, it’s essential to treat your platform and token economics as two separate businesses before combining their results. Many AI companies eventually follow this path: they charge a base platform fee for access and collaboration features and add token-based pricing for AI workloads. Essentially, you’re managing two distinct business models with different financial dynamics – track them individually first, then bring them together.
Platform Layer: Focus on SaaS Metrics
The platform side operates much like a traditional SaaS business, with predictable margins and fixed costs. Keep an eye on key metrics like ARR (Annual Recurring Revenue), NRR (Net Revenue Retention), Magic Number, and MAU (Monthly Active Users). These metrics are well-suited to seat-based models. For this layer, aim for gross margins in the 70–80% range [1].
This part of the business provides financial stability and predictable recurring revenue, forming the foundation for your overall financial health. However, it only tells part of the story.
Token Layer: Monitor Usage Metrics
The token layer is where growth happens, but it comes with variable costs tied to usage. To manage this effectively, track metrics like token consumption (input vs. output), gross profit per million tokens, and token expansion rate to monitor month-over-month growth. For this layer, target gross margins in the 50–65% range [1].
These metrics help ensure that AI usage is driving value without eating into profitability. A strong token expansion rate paired with healthy margins signals success, while rapid growth with shrinking margins suggests you’re subsidizing unsustainable usage.
Once you’ve gathered insights from both layers, calculate a single blended gross margin to unify the picture.
Blended Gross Margin: Bridging the Two Layers
The most critical metric in a hybrid model is the blended gross margin, which combines the platform and token layers. For example, if platform fees maintain 80% margins but token revenue drops to 30%, and token usage is growing faster, your overall margin will shrink – even if ARR looks strong [6]. Relying solely on ARR can mask deeper profitability challenges at the workload level.
To get a clear view, create two separate P&Ls – one for the platform and one for tokens – before merging them. The gap between these results will highlight where you need to focus strategically. Use blended margins to identify which users are profitable and which are driving up costs.
| Metric Layer | Primary Metrics | Margin Target |
|---|---|---|
| Platform Layer | ARR, NRR, Magic Number, MAU | 70–80% [1] |
| Token Layer | Token Consumption, Gross Profit per 1M Tokens, Expansion Rate | 50–65% [1] |
| Blended Bridge | Blended Gross Margin | 60–70% (Target) |
To maintain control, set up automated alerts when token usage reaches 80% or 95% of allocated amounts to avoid unexpected costs and protect profitability [1]. Additionally, tie sales compensation to contribution margin rather than top-line ARR. These tactical steps help ensure that growth aligns with sustainable profitability.
The Mistake That Cuts Across All 3 Models
The biggest issue isn’t choosing the wrong metric – it’s using metrics built for a completely different business model. This often happens when founders adopt a SaaS dashboard and apply it to AI economics without questioning if it makes sense.
Here’s how these mismatches show up in consumption, hybrid, and seat-based models.
What Happens When Metrics Don’t Match
For a consumption-based company, focusing on the Magic Number might make your sales efficiency look great because sales spend is low compared to usage growth. But this ignores the infrastructure costs that eat into margins with every query. You’re celebrating efficiency while gross profit quietly collapses.
In a hybrid model, reporting blended ARR without separating platform revenue from token revenue can paint a misleading picture. Your company might seem to be growing quickly, but if your high-margin platform revenue is stagnant while your low-margin token revenue is skyrocketing, profitability is actually declining. In fact, 65% of IT leaders report unexpected charges from consumption-based AI pricing, with costs overshooting estimates by 30% to 50% [1].
For a seat-based company with AI features, ignoring gross margin variance across customers can hide serious issues. You might see strong NRR, but that metric can mask the fact that profitable and unprofitable users are lumped together. The top 10% of power users often consume 8 to 12 times the median AI cost-to-revenue ratio [1]. Without tracking this, retention metrics can obscure the real profitability challenges.
These examples highlight why aligning your metrics with your business model is so important.
The Fix: Match Metrics to Your Model
To avoid these pitfalls, you need to align your metrics with your specific monetization model. Whether you’re working with a seat-based, consumption-based, or hybrid approach, the solution is straightforward: track metrics that actually reflect your business structure.
- For consumption-based models, focus on metrics like Burn Multiple to account for infrastructure costs.
- For hybrid models, clearly separate platform and token metrics to avoid blending high-margin and low-margin revenues.
- For seat-based models with AI features, dive into gross margin variance to understand profitability across different user segments.
When presenting to your board, make sure to clearly explain how each metric ties back to your business layers.
"The pricing set today will be misaligned within 12 months unless your governance process accounts for this deflationary rate." – Armin Kakas, Revenue Growth Analytics Expert [1]
Conclusion: Match Your Dashboard to Your Business Model
Your dashboard should reflect the true nature of your revenue mechanics. Different pricing models – whether seat-based, consumption-based, or hybrid – require tailored KPI dashboards. For seat-based pricing, where margins are steady, traditional SaaS metrics like ARR, NRR, and Magic Number remain relevant. On the other hand, consumption-based pricing demands a shift to metrics like token consumption, gross profit per million tokens, burn multiple, and first-year value. Hybrid models call for two distinct dashboards, with blended gross margin serving as the connecting metric.
Having this clarity in your metrics enables better decision-making. AI companies often face extreme cost volatility – up to 10x – and operate with tighter margin buffers (around 40%, compared to the 90% seen in traditional SaaS) [5]. As Jacob Jackson, founder of Supermaven, warns:
"If the math doesn’t work for 10 customers, it is not going to work for 10,000" [2].
Without the right metrics in place, issues can snowball long before they’re noticed.
To avoid this, align your metrics with your pricing model and report on each layer individually. For consumption-based models, don’t let a healthy Magic Number distract you from rising infrastructure costs. For hybrid models, keep platform and token revenue metrics separate to avoid confusion during board reviews. This approach ensures transparency and prevents unpleasant surprises.
Tailoring your metrics to your business model isn’t just a best practice – it’s essential. From here, the next step is adopting an AI-specific framework to refine your dashboard further. Building a metrics system that aligns with your monetization strategy is key to driving sustainable growth.
FAQs
How do I know if ARR is misleading?
ARR can sometimes mislead, especially when there’s a large gross margin variance across different customer segments. This issue is particularly common with AI products that face high inference costs, which can skew ARR as a reliable performance indicator. To get a clearer picture, evaluate your gross margins by customer segment. If you find significant differences, it might be better to focus on metrics like gross profit per token instead.
What’s the fastest way to measure AI gross margin by customer?
To quickly gauge AI gross margin by customer, focus on tracking gross profit per million tokens. This straightforward metric offers real-time insights into margins and helps you determine if the value you’re providing exceeds your costs. It’s a simple yet powerful tool for monitoring customer-level profitability.
In a hybrid model, how do I split platform vs. token revenue?
To manage a hybrid model effectively, develop two distinct P&L statements – one for platform revenue and another for token revenue. By separating these layers, you can clearly analyze their unique economic structures and margin profiles.
Use the gross margin blend as a key metric to connect the two streams. This provides insight into overall profitability and highlights any margin compression when the revenues are combined. Such a framework enables more informed strategic decisions and helps uncover any potential profitability challenges before they escalate.
Related Blog Posts
- AI Pricing Models Explained: Usage, Seats, Credits, and Outcome-Based Options
- How AI Companies Are Replacing the SaaS Magic Number & Why It’s Painfully Overdue
- How AI Companies Are Monetizing in 2026: Seats, Tokens, and the Hybrid Models Winning Right Now
- Why SaaS Metrics Like ARR and Magic Number Are Failing AI-Native Companies


