

When it comes to running a SaaS business in 2026, efficiency beats speed. Investors care less about how fast you’re growing and more about how well you’re using resources to grow sustainably. Here are the four metrics every B2B SaaS founder needs to watch – and where you should aim to be based on your ARR stage:
Key Metrics:
- Magic Number: Measures how efficiently sales and marketing spend drives new revenue. Aim for above 1.0 for strong efficiency.
- Rule of 40: Combines growth and profitability into one score. 40+ is the target for healthy scaling.
- Net Revenue Retention (NRR): Tracks revenue growth from existing customers. Over 100% is a must; 120%+ is elite.
- Burn Multiple: Shows how much cash you burn to generate $1 of new ARR. Under 1.0x is ideal for later-stage startups.
Quick Overview by ARR Stage:
- Pre-Seed/Seed (<$1M ARR): Focus on growth over efficiency. Magic Number ~0.4, NRR 95–100%, Burn Multiple 2.5x–3.4x.
- Seed to Series A ($1M–$10M ARR): Efficiency starts to matter. Magic Number 0.68–0.80, NRR ~105%, Burn Multiple 1.5x–2.0x.
- Series A to Series B ($10M–$50M ARR): Investors demand efficiency. Magic Number 0.70–0.89, NRR 105–115%, Burn Multiple 1.2x–1.5x.
- Series B+ ($50M+ ARR): Profitability is key. Magic Number 0.60–0.85, NRR 110–120%, Burn Multiple <1.0x.
The bottom line? NRR is your most important metric. A 10-point NRR boost can drive a 20–30% valuation increase. If your Magic Number or Burn Multiple is off, investors will ask questions. But strong NRR and Rule of 40 scores can keep your growth story intact.
Let’s break down how these metrics work – and how you can improve them.
Understanding the SaaS Magic Number – Benchmarks, Nuances & Investor Insights | SaaS Metrics School
sbb-itb-e8c8399
How Each Core SaaS Metric Is Defined
Getting these metrics right is critical for understanding your revenue efficiency and gauging your growth trajectory. Missteps – like confusing gross burn with net burn or using bookings instead of ARR – can throw off your calculations and hurt your credibility during board meetings or fundraising discussions.
Magic Number: Measuring Sales Efficiency
The Magic Number measures how effectively your sales and marketing spending translates into new ARR.
Formula: (Current Quarter ARR − Previous Quarter ARR) × 4 ÷ Previous Quarter S&M Spend
This formula uses a one-quarter lag because marketing efforts take time to convert into revenue. A Magic Number above 1.0 means you’re generating more than $1 of ARR for every $1 spent – indicating efficient growth. A score in the 0.75–1.0 range is solid, while anything below 0.5 signals a major concern [3][8].
For companies with long sales cycles (6–12 months), a single-quarter lag might underestimate efficiency. Also, ensure you’re calculating this using recurring revenue only – exclude professional services or one-time fees [8].
Once you’ve assessed sales efficiency, the next step is balancing growth and profitability with the Rule of 40.
Rule of 40: Balancing Growth and Profitability
The Rule of 40 provides a quick snapshot of how well your business balances growth with profitability.
Formula: ARR Growth Rate (%) + Profit Margin (%)
A score of 40 or higher reflects a sustainable business, while anything below 30 points to underperformance [2]. Use a trailing twelve-month (TTM) basis and focus on Free Cash Flow (FCF) margin, as it avoids distortions from stock-based compensation, which can account for 20–35% of operating costs in growth-stage companies [2][11].
Peter Vogel, Founder of peppereffect, explains its importance:
"The Rule of 40 is not a vanity metric. It maps almost cleanly to the EV/ARR multiple your business will trade at." [2]
Be transparent about your margin type. If your FCF-based score differs significantly from your EBITDA-based score, expect investors to dig into the reasons why.
After growth and profitability, the next priority is retaining and expanding your customer base, measured by Net Revenue Retention (NRR).
Net Revenue Retention (NRR): Tracking Retention and Expansion
NRR combines retention and expansion into a single metric, showing how much revenue you’re keeping – and growing – from existing customers without acquiring new ones.
Formula: (Starting MRR + Expansion − Churn − Contraction) ÷ Starting MRR
An NRR above 100% means your customer base is growing faster than it’s shrinking, making it self-sustaining. Scores above 120% are considered top-tier [9][5]. For private B2B SaaS companies, the median NRR is projected to be 101% by 2026, down from 108% in 2022 [1].
You should also track Gross Revenue Retention (GRR) separately. A high NRR coupled with weak GRR could indicate that upsell revenue is masking underlying churn issues [3][9].
Now, let’s look at cost efficiency, where the Burn Multiple becomes essential.
Burn Multiple: The Cost of Growth
The Burn Multiple reveals how much cash you’re burning to achieve growth.
Formula: Net Cash Burn ÷ Net New ARR
Always use net burn (total spend minus total revenue) instead of gross burn. For the denominator, Net New ARR should include (new logos + expansion) minus (churn + contraction) [10]. A Burn Multiple below 1.0x is outstanding, while the 1.5x–2.0x range is generally good. Anything above 3.0x is a warning sign [10].
For SaaS companies growing 50–100%, the median Burn Multiple is 1.8x [10]. Early-stage companies may have higher multiples, but a downward trend signals improved financial discipline – even if the absolute number isn’t ideal yet [13].
| Metric | Formula | Threshold |
|---|---|---|
| Magic Number | (Current Q ARR − Prev Q ARR) × 4 ÷ Prev Q S&M Spend | >1.0: Efficient; <0.5: Red Flag |
| Rule of 40 | ARR Growth Rate (%) + FCF Margin (%) | ≥40: Healthy; <30: Underperforming |
| NRR | (Start MRR + Expansion − Churn − Contraction) ÷ Start MRR | >100%: Self-sustaining; >120%: Elite |
| Burn Multiple | Net Cash Burn ÷ Net New ARR | <1.0x: Exceptional; >3.0x: Red Flag |
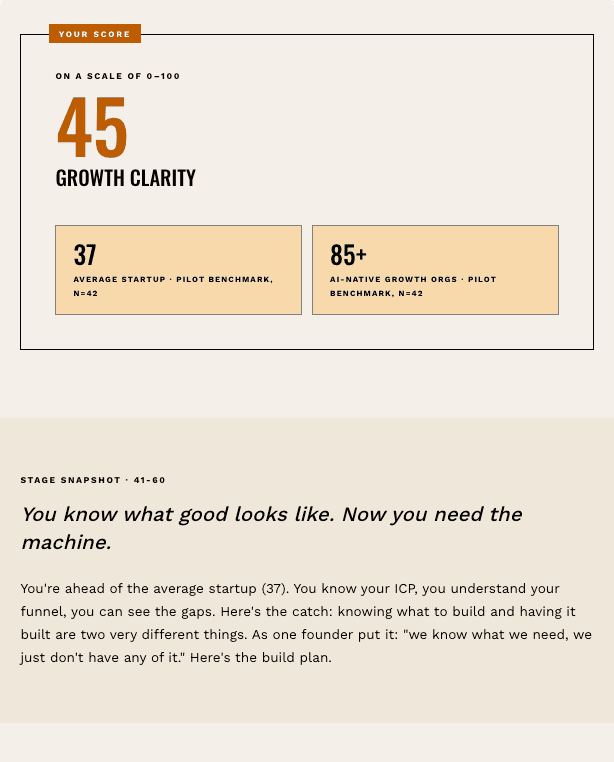
Is Your Startup Falling Behind Its AI-Native Competitors?
2026 Benchmark Ranges by ARR Stage
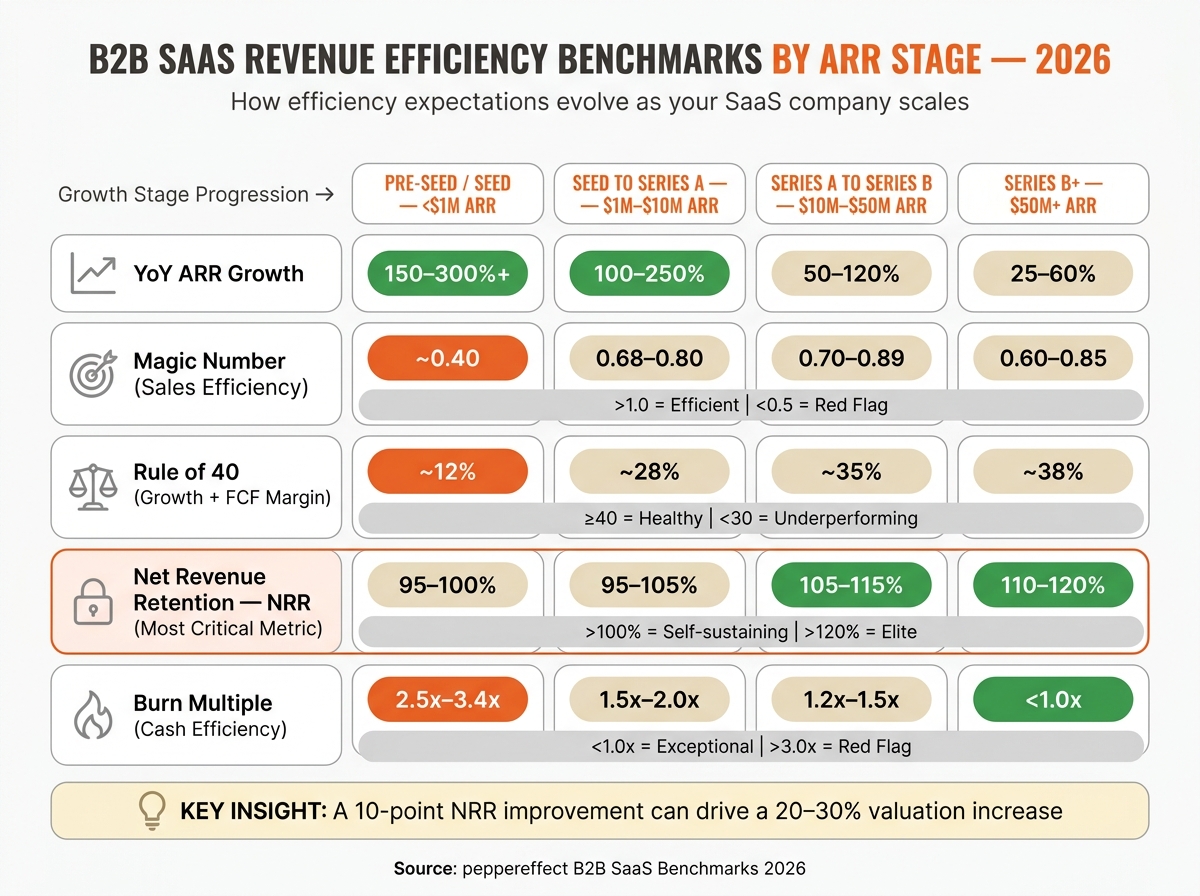
B2B SaaS Revenue Efficiency Benchmarks by ARR Stage 2026
Benchmarks vary depending on a company’s stage of growth. For instance, while a Burn Multiple of 2.5x might be a red flag for Series B investors, it’s considered normal for a pre-seed startup still working to find product-market fit.
Building on the earlier metric definitions, these benchmarks highlight how targets evolve as companies move through ARR stages. The table below provides a snapshot of 2026 benchmark ranges across key metrics and ARR stages. Use this as a reference for board meetings or fundraising discussions.
| Metric | Pre-Seed / Seed (<$1M ARR) | Seed to Series A ($1M–$10M ARR) | Series A to Series B ($10M–$50M ARR) | Series B and Beyond ($50M+ ARR) |
|---|---|---|---|---|
| YoY ARR Growth | 150–300%+ | 100–250% | 50–120% | 25–60% |
| Magic Number | ~0.40 | 0.68–0.80 | 0.70–0.89 | 0.60–0.85 |
| Rule of 40 | 12% [4] | ~28% | ~35% | ~38% |
| NRR | 95%–100% | 95%–105% | 105%–115% | 110%–120% |
| Burn Multiple | 2.5x–3.4x | 1.5x–2.0x | 1.2x–1.5x | <1.0x |
Benchmarks for Pre-Seed to Early Seed Startups
For startups in the pre-seed or early seed stage, growth speed takes precedence over efficiency. A Magic Number of around 0.40 is standard, reflecting the early experimentation with channels and messaging. NRR between 95% and 100% is acceptable but shows that expansion strategies are still in development. Burn Multiples in the range of 2.5x–3.4x are common and generally acceptable to investors [14][15].
What matters most to investors at this stage is the trend. For example, a Burn Multiple improving from 3.4x to 2.8x signals you’re starting to use capital more effectively. This progression helps establish a foundation for transitioning from experimentation to efficient scaling.
Benchmarks for Seed to Series A Startups
As companies move into the Seed to Series A stage, efficiency begins to take center stage. The median Magic Number for Series A startups in 2026 is 0.68 [16]. Numbers below 0.5 at this point can raise doubts about whether your go-to-market strategy is working. Investors also expect to see NRR approaching 105%, signaling product stickiness and early expansion success. Burn Multiples between 1.5x and 2.0x are acceptable, but anything above 2.0x after reaching $5M ARR could raise concerns [15].
The Rule of 40 becomes a relevant internal metric here, with a median of around 28% for private companies [4]. While hitting 40% isn’t expected yet, you should be prepared to explain how you’ll close the gap.
Benchmarks for Series A to Series B Startups
Startups scaling in the $10M–$50M ARR range face intense scrutiny on capital efficiency. Investors focus heavily on Burn Multiples and Magic Numbers at this stage [14]. A healthy Magic Number falls between 0.70 and 0.89, while a Burn Multiple above 1.5x indicates inefficiencies. NRR should be solidly above 105%, ideally nearing 115%, as expansion revenue becomes a bigger growth driver [4].
"The 2026 SaaS market is a two-tier environment. Median performers post 101% NRR… Top-quartile operators achieve 110–120% NRR… commanding 30–50% valuation premiums." – Peter Vogel, Founder, peppereffect [1]
Benchmarks for Series B and Beyond
At $50M+ ARR, the focus shifts to cash efficiency and profitability. A Burn Multiple below 1.0x isn’t just a goal – it’s increasingly the standard for companies at this level [14]. Rule of 40 scores should be nearing or surpassing 38%, with top-performing companies exceeding 50%, often earning valuation premiums of 30–50% as a result [1][5]. NRR above 110% is the baseline, while top-tier operators exceed 120%, driven by deliberate expansion strategies rather than one-off upsells [6][9].
AI-driven SaaS companies are outperforming these benchmarks, often achieving Burn Multiples of 0.8x–1.2x and NRR rates that are 21% higher than their traditional counterparts at similar ARR levels [1][4].
What These Metrics Signal to Investors
Investors look at these metrics as a collective snapshot of how well a company is converting resources into growth that can last. Each ratio answers a specific question, and a weak point in any one of them can prompt a deeper dive.
Magic Number: What It Reveals About Go-To-Market Efficiency
The Magic Number is a quick way for investors to gauge whether your sales strategy is delivering results worth further investment. A score above 1.0 signals that your sales motion is effective and ready for scaling, while anything over 1.5 is considered excellent for Seed and Series A companies [9]. On the flip side, a score below 0.5 is a major red flag.
"If your Magic Number is 0.4, adding sales headcount is probably destroying value until you fix the underlying efficiency problem." – Udit, SaaS Metrics Guide [9]
From here, the Rule of 40 provides a broader look at how growth and financial discipline balance out in your operations.
Rule of 40: Balancing Growth and Financial Discipline
The Rule of 40 helps investors understand whether you’re striking the right balance between growth and profitability. In today’s market, especially after 2022, profitability has taken on more importance compared to the earlier "growth-at-all-costs" mindset [12]. A score under 20% at the Series B stage can raise concerns, while anything below 30% at $100M+ ARR signals deeper issues [12].
Companies that consistently score above 40% tend to trade at revenue multiples two to four times higher than those that don’t [12]. For example, Palantir reported a Rule of 40 score of ~62 in 2026, driven by ~26% revenue growth and a ~36% free cash flow (FCF) margin. Datadog, on the other hand, maintained a solid score of ~50 with ~25% growth and ~25% FCF margin [12]. Investors also pay close attention to the trend over several quarters – they want to see whether your discipline is improving or slipping.
Next, NRR sheds light on customer loyalty and the stickiness of your product.
NRR: A Window Into Product Stickiness and Customer Loyalty
Net Revenue Retention (NRR) is one of the clearest signals investors use to measure product-market fit after the initial sale. An NRR above 100% means your current customers are driving growth by spending more over time, offsetting any losses from churn or downgrades [1]. This kind of self-funded growth reduces your reliance on acquiring new customers to hit your growth goals.
"NRR above 115% is the single strongest predictor of a Series B-to-C valuation uplift in 2026 B2B SaaS." – Peter Vogel, Founder, peppereffect [19]
Investors also compare NRR to Gross Revenue Retention (GRR). A high NRR paired with a low GRR can be a red flag, suggesting that expansion revenue is hiding significant churn [19][9]. Companies like Datadog, with an NRR of 120–123%, showcase the kind of expansion built into their pricing models that investors trust. Their usage-based pricing scales naturally with customer infrastructure, making their growth more predictable [19].
Burn Multiple: A Test of Scaling Discipline
The Burn Multiple is a straightforward measure of how efficiently a company is scaling. It calculates how much cash is spent to generate each new dollar of ARR. A low Burn Multiple shows disciplined growth and smart capital use. On the other hand, a high Burn Multiple – especially above 1.5x after the Series A stage – suggests the company is overspending without seeing enough return.
This metric is hard to manipulate, which makes it especially valuable to investors. It reflects the real cost structure of your growth engine rather than just the results. As of 2026, many investors see a Burn Multiple below 1.0x as a baseline expectation, not a bonus, as the market increasingly rewards capital efficiency over pure growth speed.
Levers to Move Each Metric in the Right Direction
Understanding your benchmarks is just the beginning; knowing how to act on them is what drives results. Let’s break down practical steps to improve key metrics.
How to Improve Your Magic Number
Start by fixing your funnel before adding more salespeople. Here’s a quick win: responding to inbound leads within an hour boosts conversion rates to 53%, compared to just 17% if you wait 24 hours [1]. This simple tweak can improve your Magic Number without increasing your budget.
Your channel mix is another critical factor. Organic and SEO channels convert MQLs to SQLs at 51%, while paid channels lag behind at 26% [1]. If you’re leaning heavily on paid acquisition, you might be spending more than necessary to acquire each dollar of ARR. Before scaling your budget, take a hard look at where your best-fit customers are coming from.
"The correct use of a benchmark is: ‘This metric is below benchmark. Is that because of a problem or because of a deliberate strategic choice?’" – Udit [9]
Your company’s stage also plays a role. If you’re between $1M–$10M ARR, founder-led sales keeps CAC low and helps validate your ICP before building a sales team. Once you hit $10M–$50M ARR, the focus shifts to expansion revenue, which should account for 40–50% of new ARR at this stage [18][6]. Expansion revenue is especially powerful because it doesn’t come with additional acquisition costs, directly improving your Magic Number. Strengthening customer retention further amplifies these gains.
How to Improve Your Rule of 40 Score
The best way to lift your Rule of 40 score is by improving NRR – not by slashing costs. Boosting NRR by 10 percentage points can add 5–8 points to your Rule of 40 score [20], all without spending on new customer acquisition. This approach also strengthens the broader efficiency of your business.
"The fastest path to a higher Rule of 40 score isn’t cutting costs – it’s improving NRR." – Trace Cohen, Founder, Value Add VC [20]
Annual price increases of 10–15%, combined with new feature rollouts, can add 1–3 margin points without triggering major churn [2]. Take Cloudflare as an example: they achieved a Rule of 40 score of 75 in Q1 2026 by pairing 34% growth with a 41% free cash flow margin [20]. For most mid-market companies, the path to a strong Rule of 40 score lies in improving gross margins and NRR, rather than aggressive cost-cutting.
How to Improve NRR
One quick fix? Optimize your dunning process to recover failed payments with automated retry sequences. This can typically be implemented in a week or two and often delivers a 1–3% NRR improvement right away [21][22].
For a more structural improvement, rethink your pricing strategy. Shifting from flat-rate to usage-based pricing can increase NRR by 10–15 percentage points. Notion, for instance, achieved 130% NRR by driving viral seat growth, upselling freemium users with AI features, and cross-selling effectively [22][23]. High-NRR companies succeed because expansion is built into their product experience, rather than relying solely on sales teams.
Reducing early churn is another critical lever. Since 60–70% of annual churn happens within the first 90 days [23], onboarding quality has a massive impact on your NRR. Customers who adopt three or more product integrations churn at just one-third the rate of standalone users [23]. This underscores the importance of emphasizing integration depth during onboarding. Addressing early churn also helps you optimize cash burn by improving both top-line efficiency and cost control.
How to Lower Your Burn Multiple
Improving your Burn Multiple means growing ARR faster than you consume cash. This can be achieved by either reducing burn, increasing ARR efficiency, or both. The most effective starting point is improving pipeline quality rather than simply increasing pipeline volume. Pursuing low-fit leads inflates S&M costs without building sustainable ARR.
"The 20-month median CAC Payback is the most important benchmark shift in 2025. It means that the funding environment assumption – raise money, spend on acquisition, grow – is broken for most companies." – The SaaS Library [18]
For Series A companies and beyond, your Burn Multiple should trend toward 1.0x or lower. If it’s above 1.5x, the problem is rarely tied to a single expense. More often, it’s a mix of an extended CAC payback period, weak NRR, and an inefficient sales motion. Tackling these root causes will help sustainably lower your Burn Multiple over time.
Reading All Four Metrics Together by Growth Stage
When viewed collectively, these metrics highlight how priorities shift as your company grows.
At the earliest stage ($1M–$5M ARR), the focus is on the Magic Number and NRR. These metrics indicate whether customers stick around (NRR at or above 100%) and whether your sales process is repeatable (Magic Number above 0.60). The Rule of 40 isn’t as critical here, as high burn rates are expected while you’re still working on product-market fit. A Burn Multiple between 1.5x and 2.5x is acceptable as long as scalability is within reach.
For companies in the $5M–$20M ARR range, investors look closely at both the Burn Multiple and the Magic Number to gauge sustainable growth. Interestingly, the median Magic Number peaks here at 0.89 [8], making this stage a prime opportunity to showcase sales efficiency before the challenges of larger markets emerge. However, a Burn Multiple significantly above 2.0x can signal that growth is being bought rather than earned.
Once companies exceed $20M ARR, NRR and the Rule of 40 take center stage. At $50M+ ARR, achieving an NRR of 125% can drive 25% annual growth without adding a single new customer [17]. This compounding effect highlights why businesses with NRR above 115% tend to grow 83% faster than the median [1]. Meanwhile, the Rule of 40 target increases with scale: from 40+ at Series B to 50+ at $20M–$50M ARR, and 60+ for companies beyond $50M ARR [17].
Here’s a breakdown of how these benchmarks evolve across growth stages:
| ARR Stage | Median Magic Number | Target Rule of 40 | Target Burn Multiple | Target NRR |
|---|---|---|---|---|
| $1M–$5M | ~0.80 | N/A (focus on PMF) | 1.5x–2.5x | 100–110% |
| $5M–$20M | ~0.89 | 40+ | 1.0x–1.5x | 105–115% |
| $20M–$50M | ~0.70 | 50+ | 1.2x–1.5x | 110–120% |
| $50M+ | 0.6–0.7 | 60+ | <1.0x | 115–125%+ |
One trend stands out: a strong NRR can counterbalance a declining Magic Number. As companies grow past $20M ARR, longer sales cycles and market saturation naturally reduce the Magic Number. However, if NRR continues to rise – fueled by upsells, expansions, and low churn – the Rule of 40 can stay strong even as acquiring new customers becomes more challenging. These metrics don’t operate in isolation; they’re interconnected elements of a larger growth strategy.
"In 2026, durability – not velocity – is the ultimate growth benchmark for SaaS companies." – Jørgen Wibe, MainFoundry [5]
Together, these metrics create a roadmap for aligning your company’s performance with what investors are looking for.
Key Takeaways for SaaS Founders
The benchmarks discussed earlier highlight key metrics that SaaS founders should prioritize for smart decision-making. The big takeaway from 2026? Efficiency now outweighs speed as the top metric investors use to assess SaaS companies. Growth is only valuable when tied to cost efficiency, strong customer retention, and sustained momentum.
"The era of growth-at-all-costs is over. In 2026, capital efficiency is the price of admission." – Jamie Partridge, Founder of UpliftGTM [24]
Net Revenue Retention (NRR) is your most critical metric. Improving NRR by just 10 points can drive a 20–30% boost in valuation [7]. Plus, companies with NRR above 115% grow 83% faster than the median [1]. Without strong retention, ramping up acquisition spend simply drains cash faster. Focus on fixing retention issues before scaling your customer acquisition strategies.
A healthy NRR can also cushion the impact of a weaker Magic Number as you grow. Meanwhile, maintaining a disciplined Burn Multiple reassures investors that your growth is sustainable, not just bought. And here’s another compelling stat: every 10-point increase in your Rule of 40 score typically adds about 1.1x to your EV/Revenue multiple [4]. Together, these metrics craft a compelling story for investors.
FAQs
Which metric matters most at my ARR stage?
Net Revenue Retention (NRR) stands out as the key metric for tracking sustainable growth across different ARR stages. For early-stage SaaS companies with ARR between $1M and $5M, an NRR above 110% is a clear sign of strong customer loyalty and the ability to generate upsells. As these businesses scale, keeping NRR above 110% remains essential for long-term growth. While metrics like the Rule of 40 and the Magic Number are also important, NRR is the most reliable indicator of future success.
How do I calculate these metrics correctly from my financials?
To calculate SaaS efficiency metrics for 2026, here’s what you need to do:
- ARR (Annual Recurring Revenue): Add up all recurring revenue, leaving out any one-time fees. Make sure to adjust for churn and any expansion revenue.
- Magic Number: Take the change in ARR (comparing the current quarter to the previous one) and divide it by the prior quarter’s sales and marketing expenses.
- Rule of 40: Add your year-over-year ARR growth rate to your profit margin, such as your free cash flow (FCF) margin.
- Burn Multiple: Calculate this by dividing your net burn by the net new ARR.
- NRR (Net Revenue Retention): Measure the revenue from a specific cohort, factoring in expansion, contraction, and churn.
Stick with consistent, verified data, and always benchmark these metrics to ensure they align with industry standards.
What can I do first to raise NRR fast?
To give your Net Revenue Retention (NRR) a quick boost, start with dunning optimization to tackle involuntary churn caused by failed payments. By fine-tuning this process, you could see a 1–3% NRR improvement in just 1–2 weeks.
At the same time, focus on increasing expansion revenue. This includes spotting upsell opportunities, enhancing customer success initiatives, and addressing potential downgrades. These approaches deliver fast results without the need for major shifts like reworking pricing models or revamping onboarding processes.
Related Blog Posts
- Ultimate Guide to Marketing Channel Benchmarking
- GTM Engineering Benchmarks 2026: Time-to-First-Revenue, CAC Payback, and Pipeline Velocity for B2B SaaS
- B2B SaaS Benchmarks 2026: CAC, NRR, Churn & Growth Rates by Stage
- How AI Companies Are Replacing the SaaS Magic Number & Why It’s Painfully Overdue


