

AI marketing isn’t optional anymore – it’s essential for staying competitive in 2026. Here’s what you need to know:
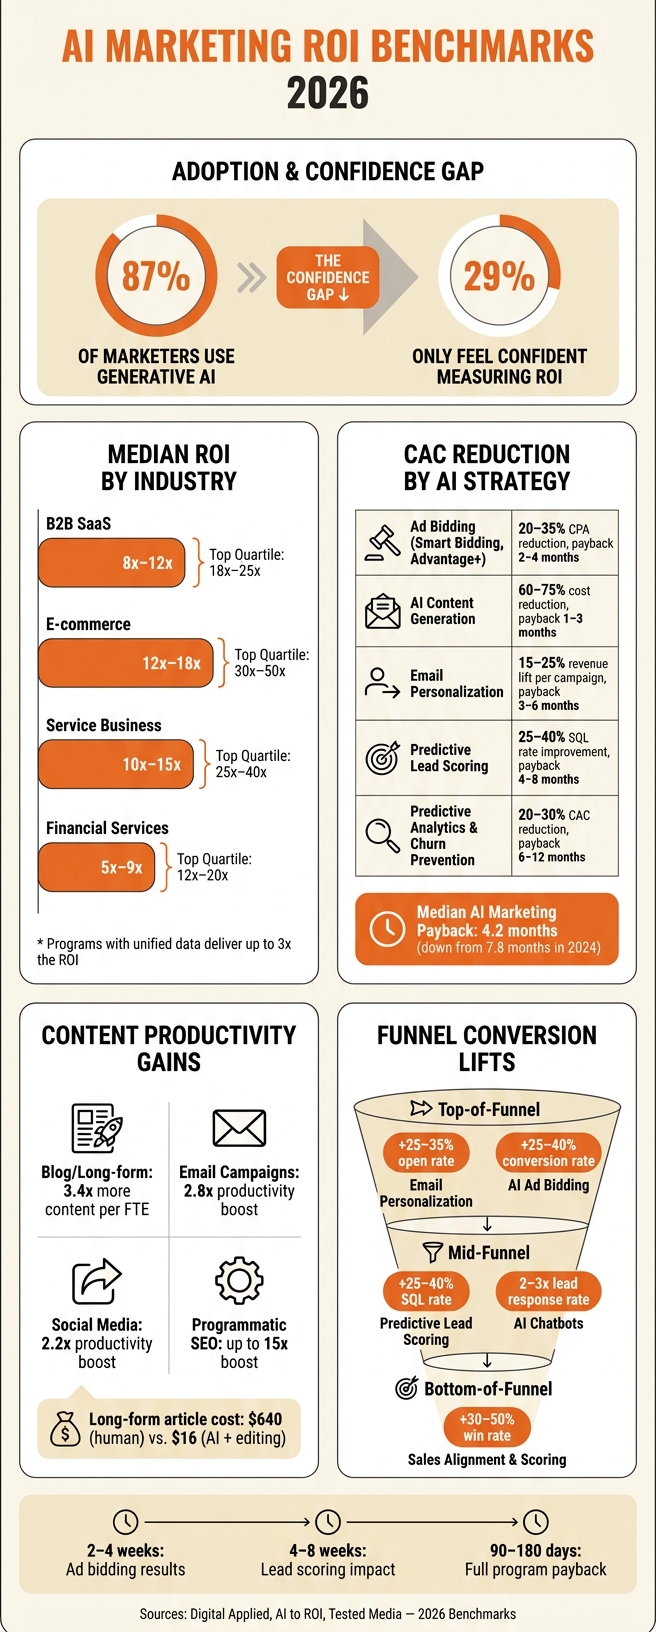
- 87% of marketers use generative AI, but only 29% feel confident measuring ROI.
- The top metrics for proving AI’s impact are pipeline influenced, CAC reduction, conversion rates, and payback periods.
- Median ROI ranges by industry: B2B SaaS (8x–12x), E-commerce (12x–18x), Service Businesses (10x–15x).
- AI tools like predictive lead scoring and ad bidding can cut CAC by 20–75% and show results in as little as 2–8 weeks.
- Content production is 3.4x faster with AI, and costs drop by 60–75%, but quality control is key.
The key takeaway? AI delivers measurable results when paired with strong data and realistic expectations. If your AI programs aren’t hitting benchmarks, focus on improving data quality and aligning tools with your go-to-market strategy. Let’s dive into how to make these numbers work for you.
AI Marketing ROI Benchmarks 2026: Key Stats at a Glance
Pipeline Influence and Revenue Impact Benchmarks
Pipeline Influence vs. Incremental Uplift: What the Numbers Mean
Let’s clear something up: pipeline influenced and pipeline created are not interchangeable terms. Pipeline influenced refers to any deal where an AI-driven interaction played a role – think emails, chatbots, or personalized ads. On the other hand, pipeline created (sometimes called incremental uplift) is about deals that wouldn’t have existed without AI. The difference between these metrics can be substantial. Confusing the two can lead to inflated ROI claims, which might not hold up under scrutiny from a CFO.
AI leaders are seeing real gains, with reported revenue increases ranging from 3% to 15% and sales ROI improvements of 10% to 20% [3]. For example, collaborative lead scoring and predictive models can boost SQL rates by 25–40%, while personalization efforts often lift conversion rates by 15–25% [7][9].
Here’s a concrete example: A B2B SaaS company handling 800 leads monthly adopted HubSpot AI predictive scoring along with GPT-based email variations in 2025. Their lead-to-MQL conversion rate jumped from 12% to 19%, and MQL-to-SQL conversion rose from 28% to 34%. This drove monthly sourced revenue from $73,000 to $124,000 – a $51,000 lift – while spending just $4,200 per month on tools. That’s a 12.1x ROI [10].
These benchmarks provide a foundation for assessing performance across different go-to-market (GTM) strategies.
Pipeline Benchmarks by GTM Motion and Program Type
Your GTM motion plays a big role in determining ROI. For instance, sales-assisted B2B SaaS often sees lower ROI multiples but larger absolute revenue gains. Meanwhile, service businesses and e-commerce tend to achieve higher ROI, especially when AI is used to enhance speed-to-lead or manage inbound calls. The table below outlines median and top-quartile ROI benchmarks by industry [10]:
| Industry | Median | Top Quartile |
|---|---|---|
| B2B SaaS | 8x–12x | 18x–25x |
| E-commerce | 12x–18x | 30x–50x |
| Service Business | 10x–15x | 25x–40x |
| Financial Services | 5x–9x | 12x–20x |
One universal factor across all GTM motions is data quality. Programs built on unified, high-quality customer data can deliver up to 3x the ROI compared to those relying on fragmented data [10]. If your pipeline metrics are falling short, the first place to investigate is your data layer – not necessarily the AI model itself.
How Long Before AI Marketing Moves the Pipeline
ROI is one thing, but timing also matters. AI bidding and chatbots often show results in 2 to 4 weeks, while predictive lead scoring and personalization typically take 4 to 8 weeks to make an impact [7]. As for full program payback, including setup costs, most organizations see it within 90 to 180 days [3][10].
"AI is no longer asking whether it belongs in marketing. It is asking whether organizations are built to operationalize and scale it." – Ray Rike and Peter Buchanan, Authors, AI to ROI [2]
For CMOs, this means setting realistic expectations with the board. A 90-day window is a fair timeline for initial pipeline results – not 30 days. Pushing for quicker outcomes could lead to premature program cancellations and missed opportunities.
sbb-itb-e8c8399
How to Measure the ROI of AI with Christine Royston, CMO of Wrike | Ep. 416
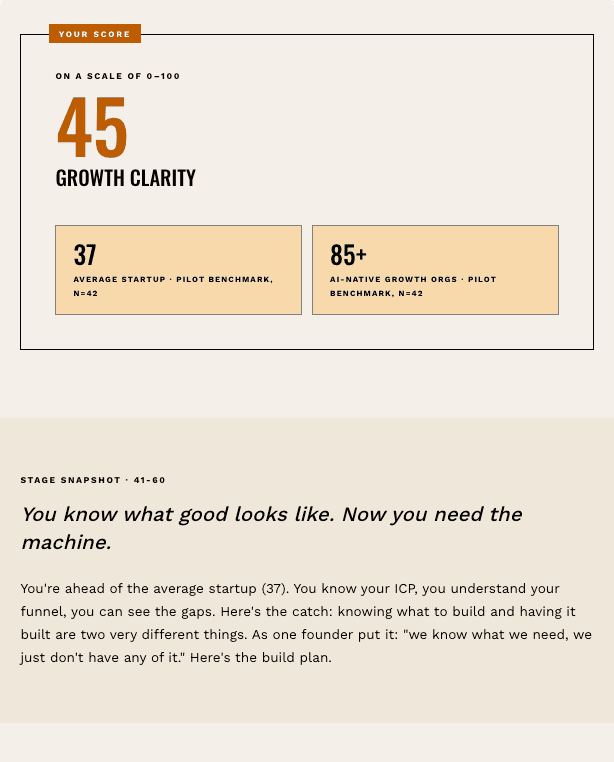
Is Your Startup Falling Behind Its AI-Native Competitors?
CAC and Payback Benchmarks for AI Marketing
This section dives into how AI tools not only cut customer acquisition costs (CAC) but also speed up payback periods, offering a clearer picture of marketing efficiency for B2B SaaS companies.
Baseline CAC and Payback Periods Before AI
Before AI enters the picture, CAC and payback periods in B2B SaaS vary widely depending on deal size and the company’s go-to-market strategy. For instance, product-led growth models often recover costs faster, while sales-assisted approaches tend to take longer. These baseline numbers matter because the impact of AI-driven improvements depends heavily on where a company starts. They provide the foundation for measuring the tangible gains AI can deliver.
CAC Reduction and Payback Gains from AI Marketing
AI marketing tools have consistently delivered measurable reductions in CAC across multiple channels. The speed and scale of these improvements depend on the specific strategy in use.
- Paid acquisition: Tools like Google Smart Bidding and Meta Advantage+ optimize ad spend, cutting cost-per-acquisition (CPA) by 20–35%. These tools typically result in payback within 2–4 months [7][9].
- Inbound and content-driven strategies: AI-powered content tools reduce production costs by 60–75%, significantly lowering CAC for organic and content marketing efforts. Payback in these channels often occurs in just 1 to 3 months [1][7].
- Outbound and lead scoring: Predictive lead scoring improves sales-qualified lead (SQL) rates by 25–40% and shortens sales cycles by roughly a week [4][7]. Payback for these programs tends to fall within 4–8 months [9].
Here’s a summary of CAC benchmarks by channel:
| AI Strategy | CAC/Cost Impact | Typical Payback Period |
|---|---|---|
| Ad Bidding (Smart Bidding, Advantage+) | 20–35% reduction in CPA [7][9] | 2–4 months [9] |
| AI Content Generation | 60–75% reduction in production costs [7] | 1–3 months [1] |
| Email Personalization | 15–25% revenue lift per campaign [9] | 3–6 months [9] |
| Predictive Lead Scoring | 25–40% improvement in SQL rates [7] | 4–8 months [9] |
| Predictive Analytics & Churn Prevention | 20–30% reduction in CAC [9] | 6–12 months [9] |
It’s worth noting that the median payback period for AI marketing tools in 2026 is 4.2 months, a significant improvement from 7.8 months in 2024 [1].
"The median payback on AI tooling investments is now 4.2 months, down from 7.8 months in 2024." – Digital Applied [1]
How AI Affects CLV:CAC Ratios
AI’s impact doesn’t stop with lowering CAC. It also drives up customer lifetime value (CLV) by improving retention and enabling more targeted upselling. For example, predictive analytics and churn prevention tools can increase CLV by 25–40% when applied consistently [9].
When you pair lower CAC with higher CLV, the CLV:CAC ratio improves significantly. For B2B SaaS companies, a ratio of 3:1 or higher is considered healthy, and AI helps companies achieve or exceed this benchmark. These dual benefits of reduced costs and enhanced customer value make AI-driven strategies a compelling choice for aligning marketing efforts with long-term profitability.
Conversion Rate and Funnel Efficiency Benchmarks
Lowering CAC and speeding up payback periods are essential goals, but improving funnel conversion rates is just as critical. AI tools are proving their worth by driving improvements across all stages of the funnel.
Top-of-Funnel Conversion Benchmarks
At the top of the funnel, AI’s impact is most noticeable in email campaigns and paid advertising. For instance, AI-generated subject lines can increase email open rates by 26% [7]. Broader personalization efforts push open rates up by 25–35% and click-through rates by 20–30% [9].
On the advertising front, platforms like Google Smart Bidding and Meta Advantage+ deliver 25–40% higher ad conversion rates and boost ROAS by 20–35% [7][9]. These results often appear within just 2–4 weeks of implementation. For Meta Advantage+ in particular, using at least 12 ad variants allows the algorithm to optimize performance more effectively [16].
These top-of-funnel improvements lay the groundwork for even greater gains as leads move further down the pipeline.
Mid-Funnel and Bottom-of-Funnel Conversion Rates
The mid-funnel is where predictive lead scoring shines. This AI-driven approach to prioritizing SQLs typically increases conversion rates by 25–40% [7]. AI chatbots, used for lead qualification, can multiply lead response rates by 2–3x [7]. These tools are especially valuable given that leads contacted within 5 minutes are 9x more likely to convert compared to those reached after 47 hours [10].
At the bottom of the funnel, the results are slightly more modest but still impactful. AI-powered sales alignment and lead scoring tools lead to 30–50% improvements in overall deal conversion rates [9]. Additionally, AI experimentation tools have demonstrated win rate increases of about 9.3% [15].
How Small Conversion Gains Add Up
Even small improvements at each stage of the funnel can create a significant overall revenue boost. For example, a 7-point increase in Lead-to-MQL, a 6-point improvement in MQL-to-SQL, and a 2-point lift in SQL-to-Won may seem minor on their own. But together, they compound to dramatically enhance revenue. A B2B SaaS case study highlighted this effect, showing monthly revenue growth from $73,000 to $124,000 [10].
"AI marketing ROI is highest when the call layer is fixed. Most service businesses lose 30 to 50 percent of inbound calls because no one picks up." – Ryan Whitton, Senior Content Strategist, Tested Media [10]
Here’s a quick reference table summarizing typical conversion lifts by funnel stage:
| Funnel Stage | AI Tool Category | Metric | Typical Lift |
|---|---|---|---|
| Top-of-Funnel | Email Personalization | Open Rate | +25–35% [9] |
| Top-of-Funnel | AI Ad Bidding | Conversion Rate | +25–40% [9] |
| Mid-Funnel | Predictive Lead Scoring | SQL Rate | +25–40% [7] |
| Mid-Funnel | AI Chatbots | Lead Response Rate | 2–3x increase [7] |
| Bottom-of-Funnel | Sales Alignment & Scoring | Win Rate | +30–50% [9] |
Content Productivity and Output Benchmarks
Content productivity is the engine that powers an effective marketing funnel. While earlier discussions centered on pipeline and CAC, this section dives into how AI growth marketing systems are transforming the speed, scale, and cost of content production for marketing teams.
Key Metrics CMOs Should Monitor
Counting total posts isn’t enough anymore. CMOs need to focus on metrics that reveal the real impact of AI investments. These include:
- Content pieces per FTE (full-time equivalent)
- Cost per asset
- Time-to-publish
- Pipeline contribution of content
As Zach Chmael, CMO of Averi, puts it:
"The competitive advantage has shifted from ‘using AI’ to ‘having AI integrated into a systematic workflow.’" [17]
The Impact of AI on Content Volume and Costs
AI is a game-changer for content production. Teams leveraging AI can produce 3.4x more content per FTE [6], with individual writers capable of publishing 2–3 articles daily, a pace that would’ve been unthinkable before [14]. Here’s how productivity increases across channels:
- Blog and long-form content: 3.4x boost
- Email campaigns: 2.8x boost
- Social media posts: 2.2x boost
- Programmatic SEO workflows: up to 15x boost [8]
On the cost side, AI slashes production expenses by 60–75% [7]. Let’s break it down:
- Long-form articles: ~$640 per piece (human-created) vs. ~$4.10 for raw AI output, or ~$16 after human editing [5].
- Marketing briefs: ~$185 (human-created) vs. ~$2.40 (AI-generated) [5].
Here’s a real-world example: BattleBridge used a 10-agent AI system for University Senior Resources (USR) to create a national senior living directory. In just three months, the system produced 4,757 community listings and 977 city-specific pages for $4,200. A traditional agency had quoted $180,000 for the same project over eight months. Post-launch, USR saw a 440% increase in organic search traffic [11].
However, scaling content without quality control creates risks. The review process is often the biggest hurdle in AI-driven content workflows. While raw AI output is cheaper, costs rise when you factor in human editing [5]. High-performing teams tackle this by embedding human checkpoints into their workflows and using standardized prompt libraries. This approach can yield up to 6x ROI on content operations [6].
Timeline for AI Content Program Results
AI content programs deliver results faster than many expect. Here’s what the timeline typically looks like:
- 1–2 weeks: Cost reductions and efficiency gains become evident [7].
- 4–8 weeks: Content volume increases significantly [7].
- 8–12 weeks: Pipeline contributions, such as higher conversion rates and MQL growth, start to show [10][18].
For organic search, the timeline stretches further. Long-tail keyword rankings emerge by months 3–4, with noticeable compounding effects by months 5–6. Ranking velocity continues to build through months 7–12 [17]. To accelerate these gains, teams can implement strategies to show up in AI search results more quickly. Overall, the median payback period for AI in marketing operations is 6.7 months [5].
The table below summarizes key benchmarks for AI-driven content programs:
| AI Content Metric | Benchmark Range | Time to ROI |
|---|---|---|
| Content Production Cost | 60–75% reduction [7] | 1–2 weeks [7] |
| Content Output Volume | 300–500% increase [11][18] | 4–8 weeks [7] |
| Time-to-Publish (Cycle Time) | 70–90% reduction [11][18] | 1–2 weeks [7] |
| Pipeline Contribution | 15–25% CVR lift [7] | 8–12 weeks [10][18] |
For the first 30 days, focus on efficiency and volume. Then, over the next 60–90 days, shift to evaluating pipeline impact. These metrics ensure your AI content strategy achieves both scale and measurable business outcomes.
Conclusion: How to Apply These Benchmarks to Your AI Marketing Strategy
Setting Realistic Targets Based on Benchmark Ranges
The benchmarks discussed in this article are not one-size-fits-all solutions to plug directly into your strategy. Instead, think of them as guideposts to help you evaluate your current position and set achievable goals.
Start by reviewing your last 90 days of marketing-sourced revenue and performance data to create a reliable baseline [10]. Without this, any projections will lack foundation. Once you’ve established this baseline, use median ROI figures specific to your industry as a starting point. For instance, in B2B SaaS, the median ROI tends to fall between 8x and 12x return on platform cost, while service businesses often land around 10x to 15x [10]. Top-tier results (like 25x–40x ROI) are possible but typically require advanced strategies, such as integrating AI voice agents into inbound call processes [10].
For your board reporting, consider creating an "AI P&L" – a quarterly report that tracks AI-driven revenue gains and cost savings against total program expenses, including tools, labor, and governance [12]. This framework shifts the focus from simply using AI to demonstrating measurable returns.
"Boards aren’t asking for more AI – they’re asking for results they can trust." – Ameya Deshmukh, EverWorker [13]
When forecasting, use a 12-month timeline and adjust for a 30% drop in median benchmarks during the first 90 days to account for implementation hurdles [10]. A 30/60/90-day review cadence works well: 30 days to identify operational issues, 60 days to address ROI challenges, and 90 days to prepare data-backed reports for your board [13].
With clear targets and a structured approach, you can turn these benchmarks into actionable strategies. Up next – how Data-Mania can help you make it happen.
How Data-Mania Can Help
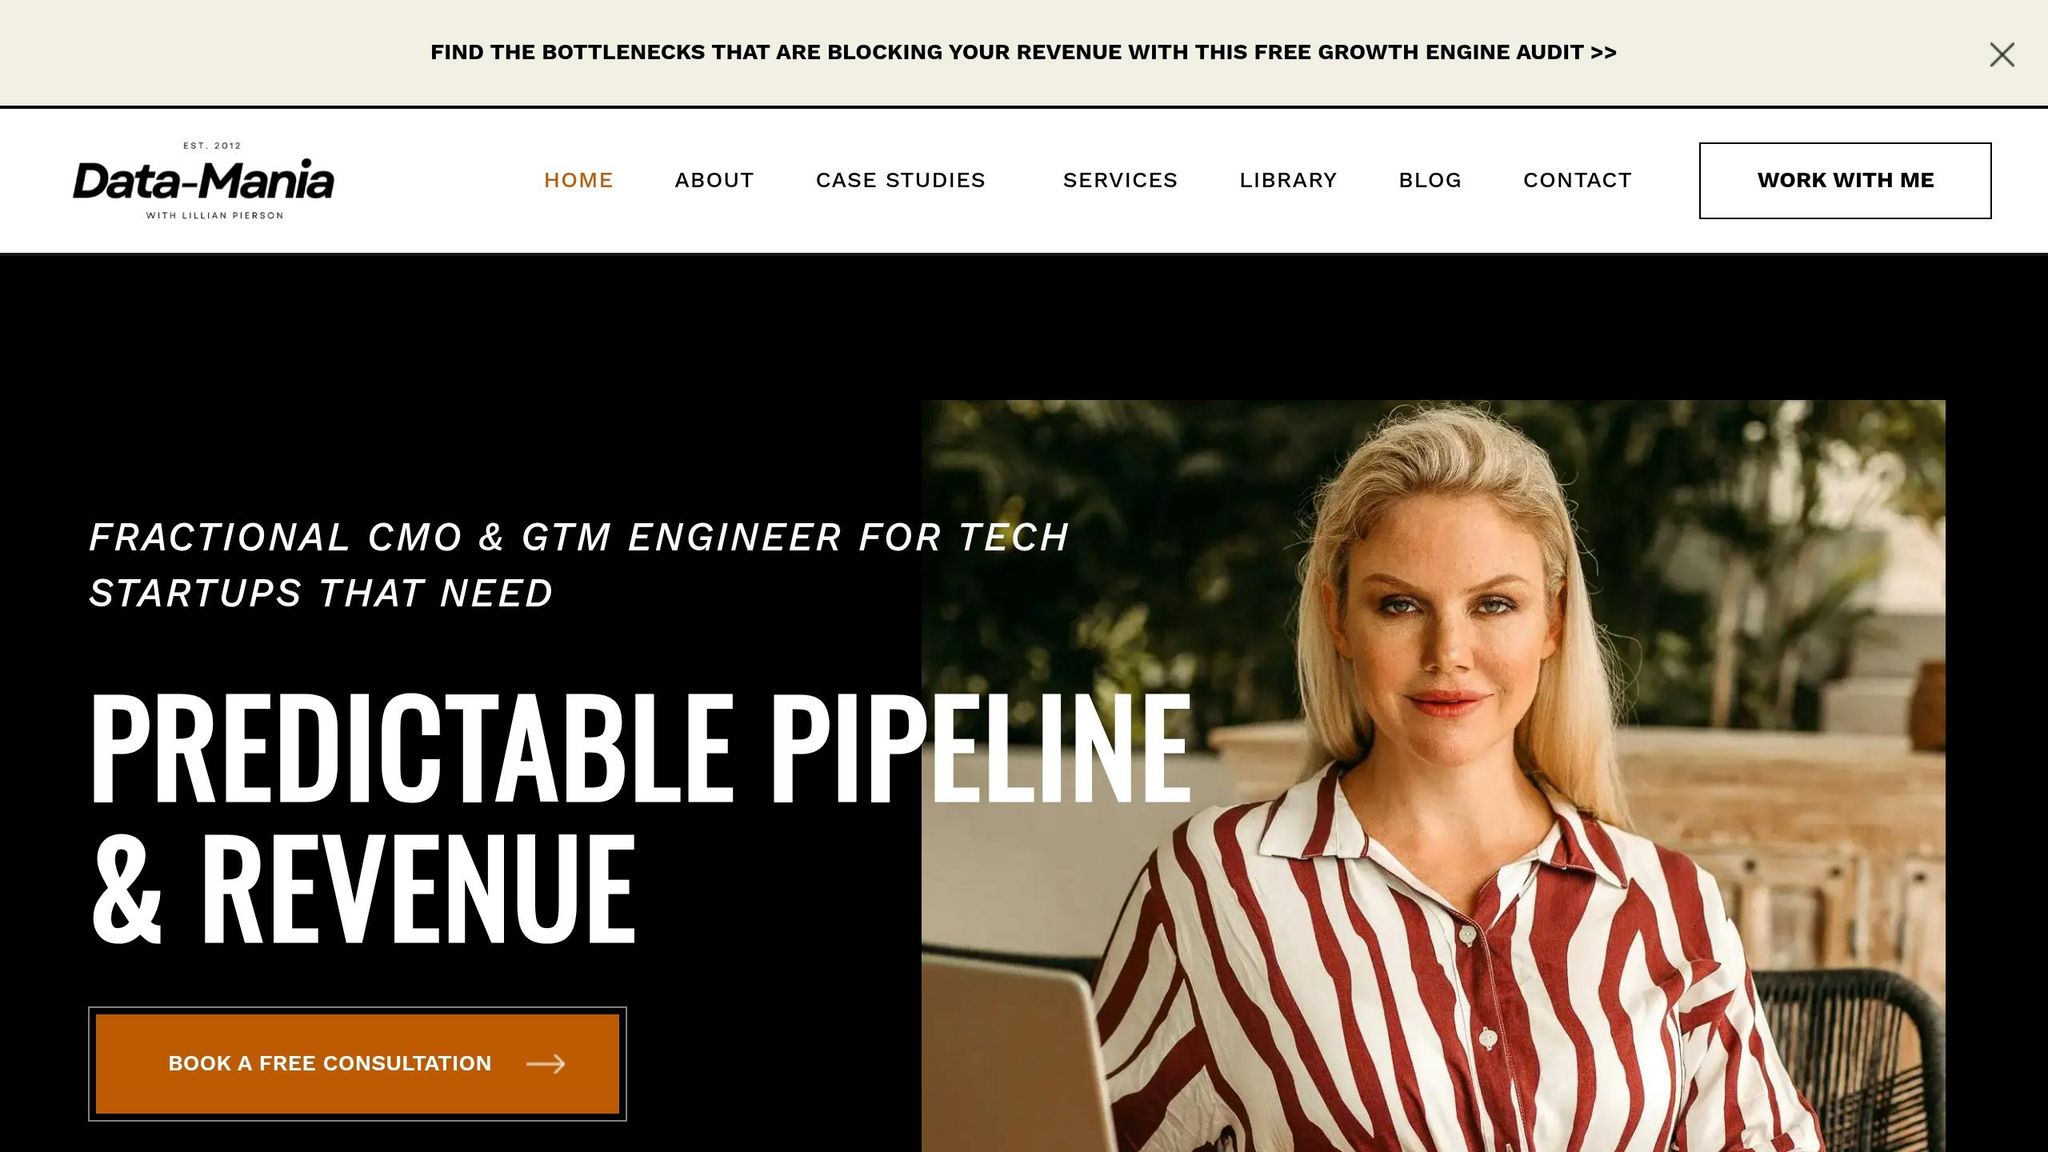
Understanding benchmarks is only part of the equation. Applying them to your unique stage, market strategy, and team capacity is where the real challenge lies. That’s where Data-Mania’s Fractional CMO services come in.
Led by Lillian Pierson, Data-Mania specializes in helping B2B SaaS, AI, and data-driven companies turn benchmark insights into clear, AI marketing plans. Whether you need help identifying high-impact AI opportunities, organizing an AI P&L for board presentations, or building workflows that generate measurable results, Data-Mania provides the strategic expertise to move the needle – without the commitment of hiring a full-time CMO.
FAQs
How do I measure incremental revenue from AI vs. pipeline influenced?
To figure out how much revenue AI is actually driving, you need to establish a clear cause-and-effect relationship. The best way to do this is through controlled testing. Start by creating two groups: one that’s influenced by AI (like specific markets, accounts, or campaigns) and a control group that isn’t. Techniques such as geo-holdouts or staggered rollouts work well for this.
Once you’ve set up your groups, calculate the incremental revenue. Take the AI-driven pipeline, multiply it by your win rate and average sales price, and then adjust for any marketing credit. By comparing these results, you can clearly separate the impact AI is having from the baseline trends that would’ve occurred anyway.
What’s a realistic 90-day AI marketing ROI goal for my industry?
A practical 90-day goal for AI marketing ROI is achieving full program payback, as most systems hit this milestone within three months. While tools like content generation might show results in just 1–2 weeks, more comprehensive programs typically need the full 90 days to cover setup expenses.
Some common benchmarks to aim for include:
- 15–25% improvements in conversion rates
- 20–35% increases in ROAS (Return on Ad Spend)
- 60–75% reductions in content production costs
To gauge success, focus on tracking marketing-sourced revenue throughout the period.
Which AI use case should I prioritize to cut CAC fastest?
To reduce Customer Acquisition Cost (CAC) fast, consider leveraging AI tools designed for ad optimization. Platforms like Google Smart Bidding or Meta Advantage+ can boost your Return on Ad Spend (ROAS) by an impressive 20%–35% within just 2–4 weeks, requiring minimal input on your part.
For businesses relying on inbound phone leads, integrating an AI voice agent can make a big difference. These tools ensure leads are responded to instantly and qualified efficiently. Additionally, predictive lead scoring can guide your sales team toward the most promising opportunities, potentially cutting CAC by 20%–30%.


