

We’ve got a problem… metrics like ARR and Magic Number worked for SaaS because they fit its economics: low costs, predictable revenue, and user-driven models. But AI-native companies play a different game. Their costs spike with every query, revenue is usage-driven, and gross margins swing wildly. Using old metrics here? It’s like measuring miles with a ruler.
What’s changed?
- Costs scale with usage: AI companies pay for every token, query, and GPU hour.
- Revenue is volatile: Customers pay based on consumption, not fixed contracts.
- Engagement isn’t user-driven: AI works behind the scenes, so logins don’t matter.
The fix is to replace outdated SaaS metrics with AI-specific ones:
- ARR → Gross Profit per Million Tokens: Tracks profitability, not just revenue.
- Magic Number → Burn Multiple: Includes compute costs in efficiency calculations.
- MAU → Token Consumption: Reflects actual usage and costs.
Bottom line here is that SaaS metrics don’t cut it for AI-native businesses. If you’re running an AI company, it’s time to rethink how you measure success.
Is ARR Dead?
sbb-itb-e8c8399
SaaS Metrics Were Built for a Different Business Model
Before AI shifts the landscape entirely, it’s worth revisiting the economic principles that made traditional SaaS metrics so effective. These metrics didn’t come out of nowhere – they were tailored to a specific business environment. For nearly 20 years, subscription-based software companies followed a predictable formula: build the product once, host it at a low cost, and scale it endlessly [2]. Adding a new customer came with virtually no additional expense [1][7]. Infrastructure scaled steadily, and revenue rolled in like clockwork. As John Ruffolo, Founder & Managing Partner at Maverix Private Equity, put it:
"That maintenance revenue was gold. Customers almost never cancelled. It was boring. It was predictable. It was beautiful" [3].
Metrics like ARR, LTV:CAC, and Magic Number thrived in this environment because they reflected the underlying economics so well. With gross margins consistently between 75–90% [3] and cost of goods sold only taking up 15–30% of revenue [11], ARR became a reliable stand-in for long-term cash flow [3][4]. Since serving additional customers didn’t increase costs, metrics like MAU worked without accounting for cost intensity [7]. The magic of these metrics lay in their alignment with the economic realities of the time.
The Economics Behind SaaS Metrics
Classic SaaS companies were built around four core principles: minimal marginal costs, seat-based pricing, human-driven engagement, and consistent revenue streams.
Once the software was developed, adding thousands of users didn’t cost the company more. Seat-based pricing created steady and predictable revenue streams, simplifying financial forecasts [1][9]. Software was designed for people to manage workflows – not for automated systems to run processes [10]. And importantly, a $100K ARR customer was essentially the same as another $100K ARR customer because usage patterns didn’t significantly affect the cost to serve them [7].
This framework relied on what Aleksei Maklakov calls the "silent assumption" of classic SaaS analytics: "usage is cheap" [7]. Infrastructure costs were disconnected from individual user activity, allowing companies to focus on revenue concentration instead of cost concentration. This is why metrics like the Rule of 40 and $100K ARR per employee became trusted indicators of success [10][11].
How These Metrics Became the Standard
ARR, LTV:CAC, and Magic Number didn’t just measure performance – they created a shared language for comparing SaaS businesses [4][5]. Since most SaaS companies operated under similar economic conditions, these metrics became universal benchmarks. Investors could use ARR as a shorthand for valuation without diving into complex financial models [3]. For instance, the SaaS Index median valuation hovered around 4.8x EV/TTM Revenue [8], offering a straightforward way to price deals.
This standardization was a game-changer. Founders knew exactly what investors wanted, and investors had a clear framework for evaluating companies. Over time, the metrics became self-reinforcing – companies optimized for them because they were rewarded for doing so. But these metrics were built on specific economic assumptions, which are worth unpacking further.
The Assumptions Baked Into SaaS Metrics
Three key assumptions underpinned the entire SaaS metrics framework. First, revenue quality is uniform. Every dollar of ARR was treated equally because the cost of delivering that revenue was consistent [4]. Second, usage is driven by humans. Metrics like MAU and DAU:MAU tracked human logins as a proxy for value creation [10]. Third, revenue is predictable. Recurring monthly or annual contracts provided steady, reliable income [3].
These assumptions worked well for traditional SaaS. However, they start to fall apart in scenarios where inference costs grow with every query, AI agents replace human users, and revenue fluctuates based on token consumption. As James Colgan explains, traditional SaaS metrics were "designed around a simple, scalable model: fixed pricing, predictable revenue, and minimal marginal cost" [5]. AI-native businesses break all three of these rules, highlighting why the old metrics no longer fit.
How AI-Native Companies Are Different
AI-native companies challenge the traditional playbook for SaaS metrics. The economics don’t just shift – they flip entirely. While traditional SaaS thrives on minimal marginal costs and predictable revenue streams, AI-native businesses face hefty compute expenses with every interaction [6]. This creates a model that might look like SaaS on the surface but operates under entirely different rules.
Here are three key ways AI-native companies reshape the economic landscape.
Gross Margins Are Unpredictable
Traditional SaaS companies typically enjoy gross margins of 75–90%, and those margins stay relatively consistent [3]. AI-native businesses, however, can see margins drop to as low as 40% once inference costs are factored into the cost of goods sold (COGS) [1]. Expenses scale with tokens, queries, and GPU hours instead of licenses or seat counts [1,2]. As a result, two customers with the same $100K ARR can have vastly different economics – one with light usage might yield 80% margins, while another with heavy inference usage could see margins plummet. Tony Kim of BlackRock points out that ARR can mislead when cost structures vary so widely [12]. In AI-native models, the once-stable link between revenue and delivery costs is broken; ARR can remain steady even as operational costs skyrocket [1,7].
This volatility in margins also changes how products are consumed.
Consumption Outpaces Seat-Based Models
AI-native companies don’t sell access – they sell work [6]. Customers might not even log into a dashboard but still derive significant value through APIs, automated agents, or embedded AI workflows. This shift renders traditional engagement metrics like Monthly Active Users (MAU) irrelevant. Costs now scale with tokens, queries, and GPU usage, disconnecting profitability from user counts. A single “active” user can drive massive costs while paying a flat fee, making “active” status a potential liability rather than a success metric.
This shift is reflected in the rise of consumption-based pricing. By 2026, 60% of SaaS providers will have adopted consumption-based models, up from just 27% five years earlier [12]. OpenAI and Anthropic are prime examples. In September 2025, OpenAI generated $12 billion in annualized revenue, with 73% coming from ChatGPT subscriptions and 27% from API services priced per token. Similarly, Anthropic earned approximately $1 billion, with 85% of revenue from API usage and only 15% from direct consumer subscriptions [12]. The value now lies in the API layer, not in user logins.
Revenue Becomes Less Predictable
The combination of fluctuating margins and the shift to consumption-based models has also redefined revenue predictability.
Traditional SaaS revenue was stable, thanks to annual or monthly subscriptions that provided a steady renewal base. AI-native revenue, however, operates under what John Ruffolo, Founder & Managing Partner at Maverix Private Equity, calls "Recurring-Occurring Revenue" (ROR) – usage-based revenue that feels recurring until it doesn’t [3]. As Ruffolo explains:
"ARR implies long-term contracts and high switching costs… ROR implies transactional usage and ‘see you next month… maybe’" [3].
This volatility makes standard LTV calculations and customer segmentation unreliable. The formula (ARPA × Gross Margin / Churn) assumes steady usage, but AI usage often spikes and drops unpredictably within a single quarter [6]. Much of this revenue is transient as customers experiment with AI tools and quickly switch to alternatives [12].
Companies like MongoDB and Snowflake have adapted by rethinking how they measure ARR for consumption-based products. MongoDB uses a 90-day rolling average for its Atlas product to filter out short-term fluctuations [6]. Snowflake, on the other hand, separates Remaining Performance Obligations from Product Revenue to distinguish between "Shelfware Risk" (unused commitments) and "Burn Risk" (active consumption) [6]. These adjustments are necessary because traditional metrics fail to capture the dynamic nature of AI-native revenue streams.
7 SaaS Metrics That Break for AI-Native Companies
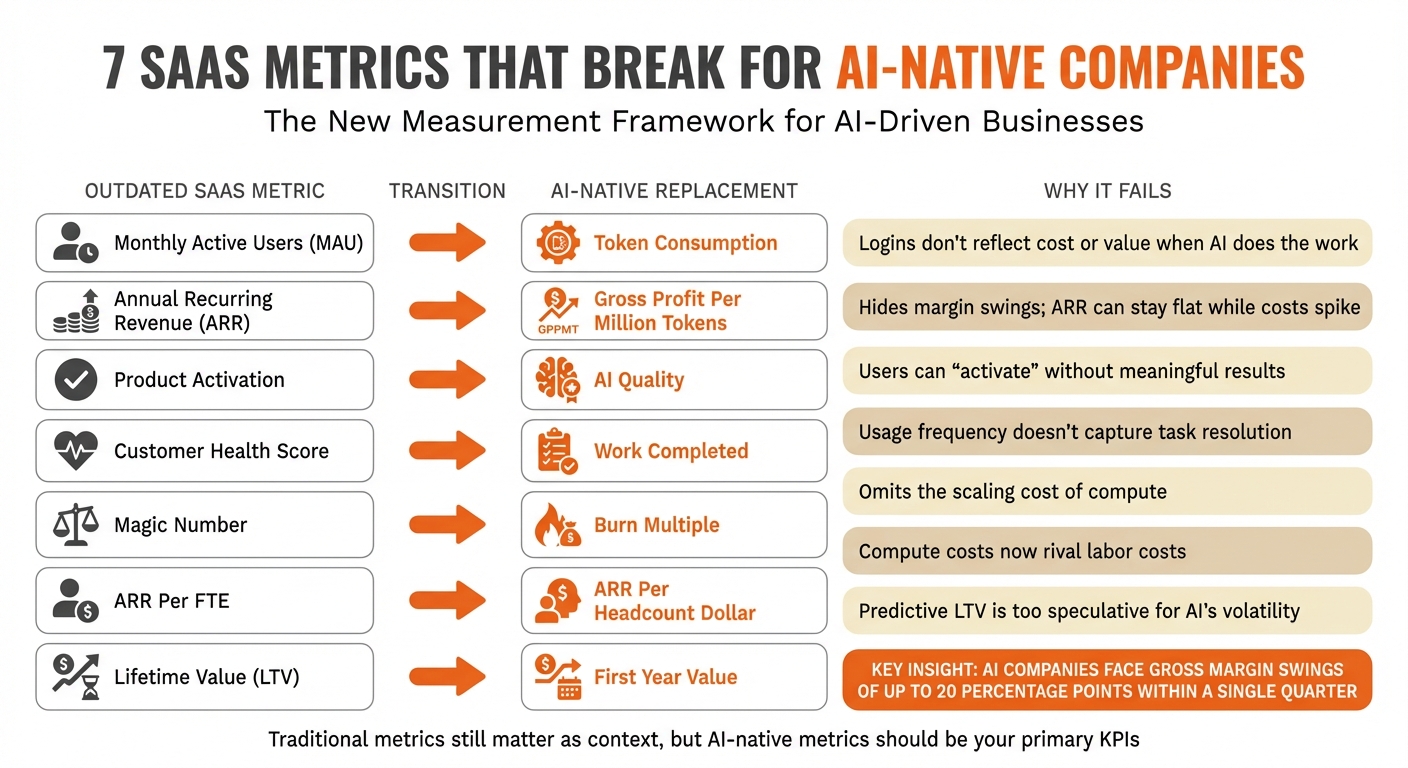
SaaS vs AI-Native Metrics: 7 Critical Shifts for Measuring Success
For AI-driven companies, traditional SaaS metrics often fall short. While they don’t disappear overnight, these metrics become less reliable as indicators of success. Here’s a breakdown of what changes, what replaces it, and why these adjustments are critical.
Monthly Active Users → Token Consumption
Counting logins worked well for traditional software, but AI products often operate behind the scenes, such as through APIs or embedded agents. This makes login counts irrelevant for understanding engagement.
A common issue is outlier usage. For instance, one AI company reported a customer generating $35,000 in monthly usage while paying just $200 for an unlimited plan [1]. On paper, this customer seemed "active", but their activity was driving up costs instead of value. By tracking token consumption, you can measure compute usage directly. A sudden drop in token usage could warn of churn or signal that a customer has moved to a cheaper option. Unlike logins, token tracking reflects the actual cost and value of AI usage.
ARR → Gross Profit Per Million Tokens
Annual Recurring Revenue (ARR) assumes all revenue dollars are equal, but AI companies know that’s not true. Two customers with the same $100K ARR can have drastically different margins depending on how they use the product. One might run simple queries on efficient models, while another relies on expensive, resource-heavy prompts.
"Margins that once looked like 80% can collapse to 40–50% when inference costs are treated as COGS" [1].
Switching to gross profit per million tokens reveals profitability at a granular level, helping you understand how growth impacts costs. This metric ensures you’re not just scaling expenses alongside revenue.
Product Activation → AI Quality
Traditional activation metrics often count sign-ups or initial usage, but with AI, these numbers can be misleading. Users might run many prompts but receive poor results, leaving them dissatisfied even if activation metrics show "success."
Instead, focus on AI quality metrics like prompt success rates, model satisfaction, or resolution accuracy [13]. These metrics measure whether your AI is delivering meaningful outcomes, not just activity.
"ARR is a milestone, not a compass. It tells you how far you’ve come – not where to go next" [13].
Similarly, activation should reflect whether your AI is truly working as intended.
Customer Health Score → Work Completed
Generic customer health scores often combine logins, feature usage, and support tickets into a single number. But for AI products, value comes from outcomes, not access. For example, a seasonal tool like tax software might see minimal use for months but still remain "healthy."
Work completed measures the tangible results your AI delivers, such as tickets resolved, documents processed, or workflows automated. If this metric drops, it’s a clear warning sign, even if login data looks fine.
"In the AI era, software has real physics. Every prompt incurs an inference cost. Relying on traditional ARR to measure an AI business is like driving a Tesla using a road map from 1999" [6].
Magic Number → Burn Multiple
The Magic Number gauges sales efficiency by showing how much net new ARR is generated per dollar spent on sales and marketing. But in AI, compute costs often surpass headcount costs, making this metric outdated.
The Burn Multiple accounts for total capital efficiency, including infrastructure costs. By dividing net burn by net new ARR, it provides a clearer picture of sustainability. A Burn Multiple under 1x is excellent, 1–1.5x is solid, and anything above 2x suggests unsustainable spending [2]. This shift highlights the importance of factoring in compute expenses.
ARR Per FTE → ARR Per Headcount Dollar
ARR per full-time employee (FTE) used to be a reliable efficiency metric when labor was the main cost driver. But in AI-native companies, compute costs often rival or exceed salaries.
ARR per headcount dollar adjusts for this by dividing ARR by total human-related expenses, including salaries, benefits, and infrastructure costs. This metric reflects the growing dominance of compute costs. If ARR per FTE looks strong but ARR per headcount dollar is weak, it’s a sign that efficiency gains are an illusion.
Lifetime Value (LTV) → First Year Value
Traditional LTV assumes steady usage and predictable margins, but AI usage often follows a volatile "J-Curve." Customers might experiment heavily at first, then settle into unpredictable patterns [6]. Fluctuating model costs make long-term projections risky.
First Year Value (or Realized LTV) focuses on actual gross profit from a customer’s first 12 months. This approach avoids overly optimistic forecasts and keeps growth assumptions grounded.
"What looks recurring may simply be repeating. What looks sticky may be temporary" – John Ruffolo, Founder, Maverix Private Equity [3].
If customers aren’t profitable in year one, banking on future profitability is risky.
Summary Table of Metric Shifts
| Outdated SaaS Metric | AI-Native Replacement | Why the Old Metric Fails |
|---|---|---|
| Monthly Active Users | Token Consumption | Logins don’t reflect cost or value when AI does the work [1] |
| ARR | Gross Profit Per Million Tokens | Hides margin swings; ARR can stay flat while costs spike [1] |
| Product Activation | AI Quality | Users can "activate" without meaningful results [13] |
| Customer Health Score | Work Completed | Usage frequency doesn’t capture task resolution [6] |
| Magic Number | Burn Multiple | Omits the scaling cost of compute [2] |
| ARR Per FTE | ARR Per Headcount Dollar | Compute costs now rival labor costs [2] |
| Lifetime Value (LTV) | First Year Value | Predictive LTV is too speculative for AI’s volatility [6] |
These updated metrics better align with the distinct economics of AI-native companies, offering a clearer view of performance and sustainability.
Old Metrics Still Matter – Just Not as Primary KPIs
While AI-native companies are rewriting economic rules, traditional metrics still have their place – but not as the main benchmarks. They work well as a reference point, offering a baseline that investors and board members can easily understand. Metrics like ARR, Magic Number, and gross margin provide downside protection and a common language, but they’re more of a foundation than a definitive measure of success in this new landscape. For example, contracted ARR reflects stability and predictable revenue, while consumption metrics highlight the uncapped potential and real value being delivered [6][4]. To fully capture AI’s dynamic economics, these traditional metrics need to be paired with newer, more relevant indicators.
A layered approach to revenue reporting works best: break it into three streams – baseline revenue (platform fees or minimum commitments), committed usage (short-term predictability), and variable usage (behavior-driven consumption) [4]. This allows you to show investors both the promise (contracted revenue) and the reality (actual usage). Companies like MongoDB, with their 90-day rolling ARR, and Snowflake, through their reporting of RPO, demonstrate how separating revenue streams can highlight both stability and growth potential [6].
"ARR isn’t going away, but it’s no longer enough for AI revenue models." – revVana [4]
Contracted ARR still carries significant weight with investors, often commanding 10–12x multiples, while usage revenue, due to its inherent volatility, typically lands in the 3–6x range [1]. To avoid undervaluing high-growth areas, separate contracted and usage revenue when presenting to stakeholders. Confluent, for instance, distinguishes its "Confluent Cloud" (usage-based) from its legacy "Confluent Platform" (subscription-based), ensuring the slower-growing business doesn’t overshadow the performance of its high-growth segment [6].
Traditional metrics should serve as context rather than the main guide. They’re useful for showing where you’ve been but not necessarily where you’re headed [13]. They help establish credibility and provide a comparison baseline, but they need to be supplemented with AI-focused metrics to tell the full story. For instance, gross margin is still relevant but must account for inference costs [5][2]. Similarly, tracking Gross Revenue Retention (GRR) alongside Net Revenue Retention (NRR) can uncover whether your overall customer base is shrinking, even if a few high-usage customers make NRR appear strong [6]. This layered approach ensures stability is acknowledged while real-time performance is accurately captured.
The goal isn’t to discard traditional metrics but to reposition them as part of a broader, dual-layer dashboard. Combining "ARR + Annualized Usage" (ARR+AU) gives investors a clear view of both the floor (downside protection) and the ceiling (growth potential) [1]. This approach balances the old with the new, ensuring a comprehensive narrative for stakeholders.
How to Report These Metrics to Investors
Start by explaining why your dashboard is evolving. While investors are familiar with traditional SaaS metrics like ARR and the Magic Number, these don’t fully capture the dynamics of AI-native businesses. The key difference? AI revenue is behavior-driven, not contract-driven. Usage ebbs and flows depending on factors like adoption rates and workload surges [4]. Even technical decisions – such as model selection, context length, or caching – carry financial weight. Help investors see that your infrastructure dashboard doubles as a financial statement [2].
Organize your board deck around three revenue layers to provide clarity:
- Baseline Revenue: Platform fees or minimum commitments that form a predictable foundation.
- Committed Usage: Revenue tied to recent, consistent patterns, offering near-term predictability.
- Variable Usage: Behavior-driven consumption that represents potential upside [4].
This framework gives investors a clear view of both the floor and the ceiling. Use ARR+AU (Committed ARR + Annualized Usage) as your hybrid run rate metric. This approach is quickly becoming the go-to standard for AI-native reporting [1]. Additionally, keep contracted ARR separate from usage-based revenue. While ARR might still command multiples of 10–12x, usage revenue typically fetches 3–6x due to its inherent volatility. This distinction ensures high-growth segments aren’t undervalued [1].
Next, shift the conversation from revenue to unit-level profitability. Highlight Contribution Margin per Task (CMPT) to show that every customer interaction – after factoring in tokens, infrastructure, and human costs – remains profitable [2]. Investors are increasingly focused on compute efficiency, or how quickly your system reduces costs as it becomes smarter. To demonstrate this, report Token ROI: the ratio of accuracy improvements to token cost increases [2]. This metric reassures investors that model upgrades are driving value rather than just inflating expenses.
Use cohort analysis to reveal predictable patterns in variable usage. Segment your customer base into power users and casual adopters to ensure heavy users don’t distort overall health metrics [1]. Track both Gross Retention Rate (GRR) and Net Revenue Retention (NRR) to provide a balanced view. GRR highlights whether your broader customer base is shrinking, even if a few "inference whales" boost NRR [6]. When defining churn, align it with your product’s natural usage cycle instead of defaulting to arbitrary monthly periods [6].
Transparency about margin volatility is equally important. As one investor put it:
"You cannot run an AI company like a SaaS company. Your biggest cost isn’t headcount anymore, it’s intelligence. And every time your model improves, your P&L changes." – Investor Quote via All That Noise [2]
AI companies often face gross margin swings of up to 20 percentage points within a single quarter due to fluctuating usage patterns [1]. To address this, use rolling forecasts updated monthly instead of static annual plans. Implement dynamic margin alerts – internal triggers that flag when inference costs exceed specific thresholds, such as 40% of revenue [1]. This proactive approach shows that you’re actively managing the risks of the "AI Tax" rather than ignoring them.
Conclusion
Once you’ve rethought your metrics and reporting framework, one thing becomes evident: traditional SaaS metrics were designed for a world where costs were negligible, and revenue was steady and predictable. That approach doesn’t align with the economics of AI-driven businesses. For AI-native companies, every user interaction adds a cost, profit margins shift dramatically, and revenue depends more on customer activity than fixed contracts. Relying on outdated metrics isn’t just unhelpful – it can lead you astray.
The seven new KPIs introduced here offer a way to navigate this new landscape, where AI consumption – not user logins – defines business value. Many founders are already moving beyond focusing solely on ARR, adopting metrics that reflect the realities of token-based economics.
"You cannot run an AI company like a SaaS company. Your biggest cost isn’t headcount anymore, it’s intelligence. And every time your model improves, your P&L changes." [2]
This shift doesn’t mean ARR is obsolete, but it does mean it should take a backseat. Use ARR as a supporting metric, reported alongside Gross Profit per Million Tokens, and complement the Magic Number with the Burn Multiple to better capture the dynamics of a consumption-based model. Keep contracted ARR (still valued at 10–12x multiples) separate from usage-based revenue (valued at 3–6x) [1]. Companies that strike the right balance will gain investor trust, while those that stick to outdated metrics will struggle to explain why their "recurring" revenue isn’t so recurring after all.
If your dashboard still mirrors a seat-based SaaS business, it’s time for a reset. Metrics built for yesterday’s models won’t drive growth in an AI-first world. As your business evolves, so must the way you measure success.
FAQs
Which old SaaS metrics still matter for AI-native companies?
Traditional SaaS metrics, such as Annual Recurring Revenue (ARR), still hold value but fall short when applied to AI-native companies. They don’t fully capture key factors like fluctuating margins, revenue tied to usage, or the distinct value drivers unique to AI-based models. While these metrics offer some perspective, they must be paired with newer ones that align more closely with the economic realities of AI-driven businesses.
How do I calculate gross profit per million tokens?
To determine the gross profit per million tokens, start by subtracting the cost of goods sold (COGS) for those tokens from the total revenue they generate. Once you have the gross profit, divide it by one million tokens to find the per-million figure. This calculation is a key metric for assessing the economics and profitability of AI products, especially in environments with variable costs.
How should I report usage-based revenue to investors?
For companies built around AI, relying solely on traditional SaaS metrics like ARR may not provide the full picture, especially with usage-based pricing models. A more relevant metric is gross profit per million tokens, as it directly links revenue to the cost of AI inference, offering insights into unit economics. Alongside this, tracking usage metrics – such as total tokens consumed or tasks completed – gives a better sense of operational activity and customer engagement. These metrics help investors understand performance and the overall health of the business more effectively.
Related Blog Posts
- GTM Engineering Benchmarks 2026: Time-to-First-Revenue, CAC Payback, and Pipeline Velocity for B2B SaaS
- B2B SaaS Benchmarks for 2026: Annual Report
- How AI Companies Are Replacing the SaaS Magic Number & Why It’s Painfully Overdue
- How AI Companies Are Monetizing in 2026: Seats, Tokens, and the Hybrid Models Winning Right Now


