

Your GTM metrics might look fine, but here’s the issue: they often tell you what happened, not why or what to fix next. If your traffic spikes but revenue doesn’t, Is it a content issue? AI lead scoring? Sales follow-up? Most dashboards won’t tell you.
Here’s the fix: a 3-bucket KPI framework that separates Production, Distribution, and Conversion. It helps you pinpoint exactly where things break down. Here’s the breakdown:
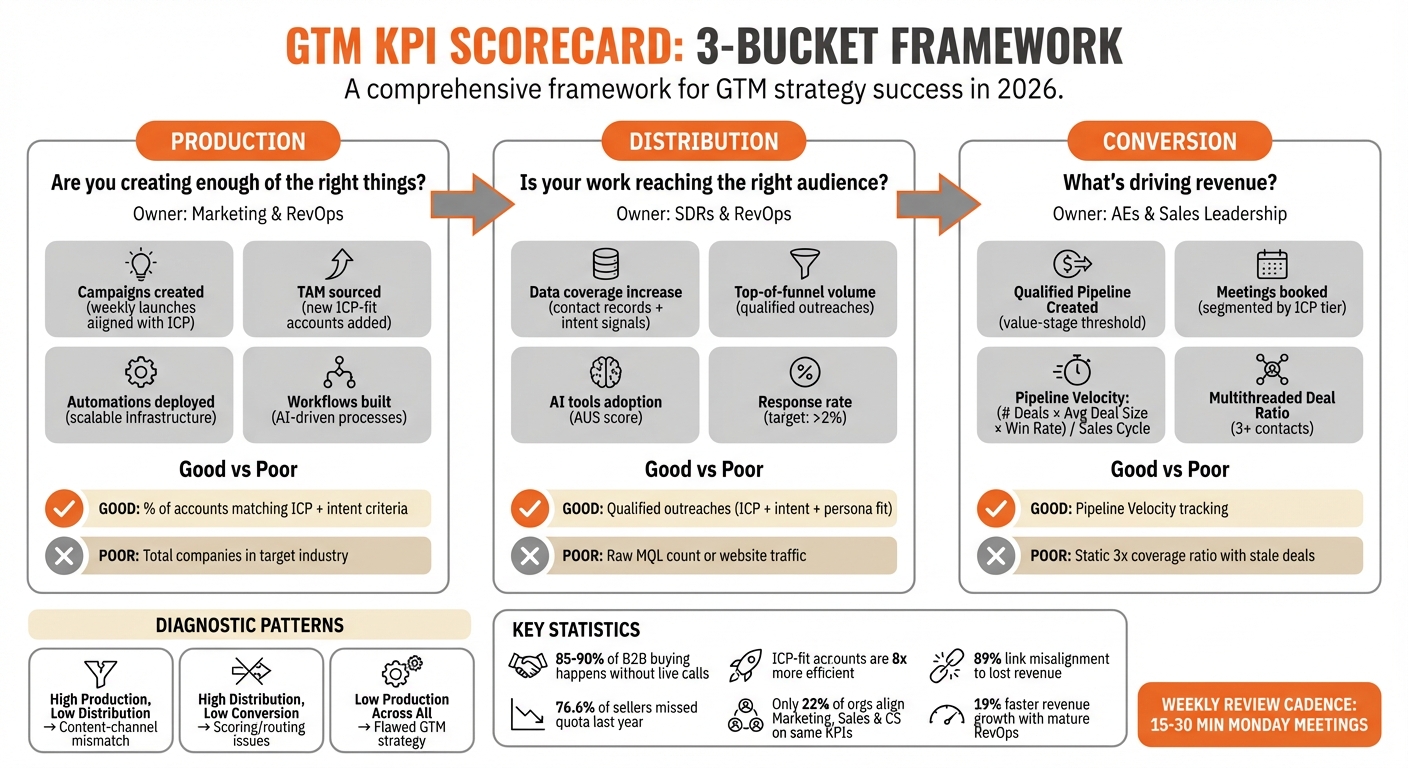
- Production KPIs: Are you creating enough of the right things? (e.g., campaigns launched, TAM sourced, automations built)
- Distribution KPIs: Is your work reaching the right audience? (e.g., data coverage, qualified top-of-funnel volume, AI tools adoption)
- Conversion KPIs: What’s driving revenue? (e.g., pipeline velocity, win rates, meetings booked)
Why this works: Instead of drowning in metrics, you focus on the single constraint holding you back. High traffic but no deals? It’s probably a distribution problem. Lots of meetings but no revenue? Look at conversion. Low activity across the board? That’s on production.
Key insight: 85-90% of the B2B buying process now happens without live calls. So, tracking clicks is not enough – you need metrics that reflect intent and impact.
The hard part? Assigning clear owners to each metric and reviewing them weekly. But when Marketing, Sales, and RevOps align around this scorecard, you stop guessing and start fixing.
GTM KPI Framework: Production, Distribution, and Conversion Metrics
How to Actually Measure GTM Performance in B2B SaaS
To contextualize these performance layers, compare your results against current GTM engineering benchmarks.
sbb-itb-e8c8399
The GTM Scorecard: 3 KPI Buckets with Definitions
This section breaks down the 3-bucket framework into actionable KPIs that highlight production, distribution, and conversion. Each bucket focuses on a specific stage in the GTM process, helping pinpoint where issues originate and how they escalate. Here’s a closer look at the metrics defining each category.
Production KPIs
Production KPIs evaluate your team’s output before it hits the market. The key question they address is: Are we creating enough of the right things?
- Campaigns created: Tracks the number of outbound or inbound campaigns launched weekly. Success here means campaigns are aligned with your ICP and target accounts showing buying intent. A poor result suggests high activity but little focus, generating noise instead of meaningful opportunities [8].
- TAM sourced: Measures the new accounts added to your addressable market that match your ICP. In 2026, the focus has shifted from Total Addressable Market (TAM) to Total Reachable Market (TRM) – accounts you can realistically win and retain [9]. A weak approach counts every company in your target industry, while an effective one looks at the percentage of self-sourced opportunities meeting specific criteria like technographics, size, and intent [4][10].
- Automations deployed and workflows built: These metrics assess scalable infrastructure, such as research automation or CRM updates, created without increasing headcount. For example, Phi Consulting helped a B2B SaaS company implement AI-driven workflows in late 2025, boosting their GTM Efficiency Ratio from 0.6 to 1.1 in just two quarters [9]. Low numbers here signal an over-reliance on manual processes, limiting scalability.
Distribution KPIs
Distribution KPIs focus on how effectively your efforts reach decision-makers. They aim to answer: Is our work reaching the right audience?
- Data coverage increase: Tracks growth in contact records, intent signals, and buying committee visibility across target accounts. A strong reading ensures that added contacts are decision-makers within ICP-fit accounts with active buying signals. In contrast, a poor reading might celebrate sheer volume without relevance [1][2].
- Top-of-funnel volume: Measures inbound and outbound activity such as website visits, demo requests, and outreach replies. The distinction in 2026 lies in the quality of these interactions – qualified outreaches must align with ICP fit, intent signals, and persona fit (decision-maker roles) [8]. As Disha Agarwal of Reo.Dev notes:
"The goal of your first outreach isn’t to sell – it’s to start a conversation." [8]
High volume with low conversion suggests you’re reaching many people but not the right ones.
- Automations deployed and agents deployed: These metrics track AI-powered tools managing research, data enrichment, and outreach. In 2026, the AI Utilization Score (AUS) measures how well representatives adopt tools for tasks like email generation and CRM automation [9]. Low AUS points to inefficiencies caused by manual workflows.
Conversion KPIs
Conversion KPIs reveal the revenue impact of your GTM efforts. They answer: What’s actually turning into pipeline and closed deals?
- Leads generated: This traditionally tracked qualified opportunities, but the 2026 standard is Qualified Pipeline Created – deals that meet a defined value-stage threshold rather than just filling out a form [1][10]. A focused GTM approach can significantly improve win rates and shorten CAC payback periods.
- Meetings booked: Tracks scheduled discovery calls or demos. A poor metric counts all meetings equally, while a strong one segments meetings by ICP tier and intent level. Meetings with Tier A accounts (closely matching your ICP) are far more valuable than those with Tier C accounts [2][9].
- Pipeline influenced and sales generated: These metrics track the dollar value of opportunities and revenue from closed deals. A critical metric here is Pipeline Velocity, calculated as: (Number of Deals × Average Deal Size × Win Rate) / Sales Cycle Length [2]. Haris Burney from Phi Consulting explains:
"Velocity collapses before revenue collapses – usually 60-90 days before your forecast shows the miss." [9]
A drop of 15% or more in Pipeline Velocity serves as an early warning sign of conversion issues [9]. Additionally, the Multithreaded Deal Ratio (MDR) tracks deals with three or more active contacts. Deals with only one contact have a 75–85% loss rate in later stages [9].
| KPI Bucket | Key Metric | Good Interpretation | Poor Interpretation |
|---|---|---|---|
| Production | TAM sourced | % of accounts matching ICP + intent criteria [4][10] | Total companies in target industry |
| Distribution | Top-of-funnel volume | Qualified outreaches (meeting ICP, intent, & persona) [8] | Raw MQL count or website traffic |
| Conversion | Pipeline Velocity | (Number of Deals × Average Deal Size × Win Rate) / Sales Cycle [2] | Static 3x coverage ratio with stale deals |
How to Diagnose GTM Problems with the Scorecard
The scorecard helps identify which part of your GTM strategy is falling short. Most failures fall into three common patterns, each tied to a specific root cause that needs a tailored solution. Let’s break down these patterns to uncover and address the gaps in your GTM process.
High Production, Low Distribution
Your team is busy creating campaigns, sourcing TAM, and setting up workflows, but something’s off. This pattern often points to content-channel mismatches, poor targeting, or tracking issues that keep your efforts from connecting with the right audience.
A key warning sign is increased activity but declining deal quality. For example, if you’re seeing high MQL numbers but low conversions, it’s likely a targeting problem. A response rate below 2% is a major red flag. As Disha Agarwal from Reo.Dev puts it:
"Anything below 2% [response rate] is a red flag – it usually means you’ve either misunderstood the buyer’s problem, or you’re targeting the wrong accounts entirely" [8].
Another indicator is acquiring logos that don’t align with your ICP. Research shows that acquiring ICP-fit accounts is 8x more efficient than chasing off-target logos [2].
How to refocus on Production KPIs:
- Audit your CRM to ensure reps are prioritizing high-value accounts in their "Book of Business" [6][11].
- Shift from tracking raw outreach volume to tracking "Qualified Outreaches" that meet three criteria: ICP Fit, Intent Fit, and Persona Fit [8].
- Prioritize high-intent signals like pricing page visits over less meaningful metrics like clicks or downloads [1].
High Distribution, Low Conversion
You’re successfully reaching decision-makers and booking meetings, but deals aren’t closing. This pattern usually points to scoring issues, routing errors, or messaging problems.
The breakdown often happens at the Lead-to-Opportunity handoff. For instance, if you’re seeing a high volume of meetings but low SQL rates, it could mean your qualification criteria are too broad, or there’s a disconnect between SDRs and AEs on what defines a "sales-ready" lead [12]. Conversion KPIs are critical because they directly measure revenue impact, and a drop in SQL quality is especially concerning. Kellyann Doyle from Go Fish Digital explains:
"When scorecards reward lead totals or cost per lead, teams are pushed toward tactics that inflate the top of funnel while quietly degrading Sales Qualified Lead (SQL) quality, win rates, and sales efficiency" [1].
Leads with low intent also slow down your pipeline – deals influenced by these leads take 20–30% longer to close compared to ICP-qualified opportunities [1].
How to refocus on Conversion KPIs:
- Tighten qualification criteria and align compensation with quality outcomes. If you reward volume but expect quality, reps will focus on volume [3].
- Monitor "Speed to Lead" to ensure high-intent signals are followed up on immediately [8].
- Separate inbound and outbound KPIs. Combining them can obscure which approach is underperforming [12].
Low Production Across All Buckets
If everything is underperforming, your GTM plan might be fundamentally flawed. Low production often signals that your strategy is operationally unrealistic. For example, 76.6% of sellers missed quota last year, often because GTM plans didn’t account for actual capacity [7]. Eddie Reynolds from Union Square Consulting highlights:
"The issue isn’t that we lack the data. It’s that our dashboard wasn’t built for this conversation" [6].
Common causes include over-hiring before demand materializes or assigning unbalanced territories.
How to refocus on Production KPIs:
- Evaluate your quota-to-capacity ratio to ensure your goals are achievable with current resources [2][7].
- Leverage AI to improve capacity instead of adding headcount. Automating workflows can help scale operations without overextending your team [13].
- Take inspiration from Udemy, which reduced annual planning time by 80% (from months to weeks) by switching from spreadsheets to an AI-powered system. This allowed for flexible, in-year territory adjustments [2][7][13].
- Hold bi-weekly outbound sessions early in the quarter to build momentum [4].
Who Owns Each KPI
Every metric on your scorecard needs a clear owner. Without someone accountable, metrics lose their meaning and impact. Eddie Reynolds from Union Square Consulting explains it best:
"The most important thing about this layer isn’t just the metrics – it’s that they’re tied to specific processes with clear owners. Every number on the scorecard should map to a lever we can pull" [6].
Misalignment is a common issue in GTM teams, with 85% of professionals reporting it, and 89% linking this directly to lost revenue [14]. The solution begins with assigning responsibility for each KPI.
Production Ownership
Marketing and RevOps take charge of the production phase. Marketing focuses on building campaigns, crafting messaging, and refining positioning [15][16]. Meanwhile, RevOps ensures the infrastructure is in place – handling TAM setup, maintaining data hygiene, and deploying automation to support campaigns [16]. Stan Rymkiewicz from Default highlights the importance of this role:
"RevOps owns the glue – without it, leads slip through cracks, reps complain about ‘bad data,’ and the feedback loop dies" [16].
Currently, only 33% of SaaS companies have full visibility into their CAC by channel or segment [6]. When there’s no clarity around production ownership, it’s nearly impossible to pinpoint whether underperformance stems from flawed campaigns or infrastructure issues. This division of responsibilities ensures every element of production contributes effectively to the GTM scorecard.
Distribution Ownership
On the Distribution side, SDRs and RevOps share the workload. SDRs handle outreach and are responsible for activity-to-meeting ratios [17]. RevOps manages the backend – lead routing rules, automated sequences, and tracking data coverage [16]. The coordination between these teams is critical: responding to a lead within 5 minutes makes you 21 times more likely to qualify that lead compared to waiting 30 minutes [17].
The approach to Distribution is evolving. By 2026, teams will shift from volume-based activity to signal-driven orchestration. SDRs are already leveraging intent data and AI-powered research to prioritize accounts [15]. For this shift to succeed, RevOps must ensure the data infrastructure supports these advanced strategies.
Conversion Ownership
When it comes to Conversion KPIs, Account Executives oversee metrics like meeting acceptance and win rates. Sales Leadership tracks pipeline velocity and revenue generation [15][17]. At the same time, RevOps Leadership focuses on conversion efficiency – figuring out where deals stall and why [6][16].
Stephen Babish from Mural underscores the importance of shared KPIs in strengthening GTM strategies:
"Shared KPIs reduce friction and power smarter decision-making" [14].
Despite this, only 22% of organizations align Marketing, Sales, and Customer Success around the same set of KPIs [2]. Companies with a mature RevOps function that bridges these gaps see a 19% faster revenue growth compared to those without [5].
With ownership clearly defined, the next priority is integrating these roles into a consistent weekly operating cadence.
Weekly GTM Operating Cadence
Once KPI ownership is set, keeping the team aligned requires a disciplined weekly rhythm.
Start the week with a 15–30 minute standing meeting on Monday mornings, bringing together leaders from Sales, Marketing, and RevOps [4]. This meeting is all about decisions. As Nathan Thompson from Fullcast notes:
"If a metric does not help a rep, a manager, or finance make a better decision this week, drop it" [2].
This session serves as the pulse of your GTM efforts, tying production activities directly to market performance and conversion results [4].
Scorecard Review Process
Work through KPIs in a set order: Production, then Distribution, and finally Conversion [6]. This sequence allows you to diagnose issues systematically. For instance, if the pipeline is underperforming, you can trace back to see if Distribution fell short or if Production didn’t generate enough campaigns. This is a common hurdle when trying to generate your first B2B leads without a massive budget.
Stick to a shared and consistent metric definition [2][3]. Without this, discussions can devolve into disputes over data accuracy. Automate the prep work using CRM snapshots so the meeting stays focused on decision-making [4]. Prioritize leading indicators like pipeline velocity and activity-to-meeting ratios instead of lagging metrics like closed revenue [7][17].
| Review Phase | Focus Area | Key Metrics to Check |
|---|---|---|
| 1. Production | Planning & Coverage | Qualified Outreaches, Lead Volume, ICP-Fit Logos [2][8] |
| 2. Distribution | Performance & Execution | Pipeline Coverage Ratio, Sales Velocity, Activity-to-Meeting Ratio [2][17] |
| 3. Conversion | Efficiency & Outcomes | Win Rate, SQL-to-Close Rate, CAC payback periods, NRR [2][17][1] |
Once the review is done, immediately zero in on the most pressing issue.
Pick One Constraint to Fix
After reviewing the data, focus on the biggest bottleneck. Identify the single constraint and direct all efforts there [6]. For example, maybe your Speed to Lead is lagging, or your Outbound Connect Rate has dipped. Eddie Reynolds from Union Square Consulting highlights a common challenge:
"The issue isn’t that we lack the data. It’s that our dashboard wasn’t built for this conversation" [6].
To address this, layer your metrics: start with Outcome metrics (results), then Efficiency metrics (how well things are working), and finally Process metrics (where things are breaking down) [6]. Assign follow-up tasks with clear deadlines – usually by Wednesday – to maintain momentum [4]. Teams with well-aligned Sales and Marketing functions grow 20% faster than those without alignment [7].
Log Changes for Learning
Document every adjustment – whether it’s routing rules, campaign tweaks, or scoring updates – in a shared log to avoid losing track of changes [4]. This practice ensures your team retains institutional knowledge and avoids repeating mistakes. Koen Stam from GTM OS underscores this point:
"The system doesn’t hide inefficiency; it makes it visible" [4].
Capture findings, coaching actions, and the reasoning behind decisions [4]. This transforms your GTM strategy from a static plan into a flexible system driven by evidence, not guesswork [3][4]. Only 22% of organizations align Marketing, Sales, and Customer Success around the same KPIs [2]. Keeping a log guarantees alignment and fosters learning across all three KPI categories, reinforcing continuous improvement.
Conclusion
The Production → Distribution → Conversion framework offers a practical way to align your GTM efforts with measurable outcomes, cutting through the uncertainty. This structure lets you track progress from high-level revenue goals (Conversion) back to the operational details (Production) that drive them, creating a direct connection between strategy and execution [6]. Eddie Reynolds, Founder & CEO of Union Square Consulting, captures this approach perfectly:
"Dashboards aren’t strategy. They’re not process. They’re not insight. But a layered scorecard… is strategy in motion" [6].
This layered scorecard acts like an early warning system, identifying potential issues 60–90 days before they affect your marketing forecasts [9]. Weekly reviews of Production, Distribution, and Conversion metrics reveal where processes break down and highlight the exact levers to adjust, removing the need for last-minute problem-solving [6].
When Marketing, Sales, and Customer Success teams align around shared metrics, the entire operation becomes more cohesive and efficient. Currently, only 22% of organizations manage these functions using the same KPIs, yet 89% acknowledge that misalignment directly impacts revenue [2]. By unifying metrics across the revenue lifecycle, you replace blame-shifting with faster learning cycles that root out inefficiencies [2].
The process is simple: review your weekly scorecard, address one constraint, and document the changes. By consistently applying the Production, Distribution, and Conversion metrics, your team transforms raw data into actionable steps for growth.
FAQs
How do I choose the one GTM KPI constraint to fix each week?
To drive revenue growth effectively, start by identifying the biggest bottleneck in your go-to-market process. Use your scorecard’s three KPI categories – Production, Distribution, and Conversion – to locate the weakest link. Once you’ve pinpointed the area holding you back, tackle one constraint at a time. Whether it’s fine-tuning your messaging, enhancing tracking systems, or boosting execution capacity, addressing a single issue ensures steady progress without diluting your efforts.
What’s the fastest way to define “Qualified Outreaches” and “Qualified Pipeline Created” in our CRM?
To clarify "Qualified Outreaches" and "Qualified Pipeline Created", start by setting clear criteria using frameworks like BANT (Budget, Authority, Need, Timeline). For outreaches, look for specific signals such as positive responses or meaningful engagement from prospects. When it comes to pipeline, focus on opportunities that meet key qualification benchmarks, such as having a budget in place or involvement from decision-makers.
Use your CRM to tag or create fields that track these stages effectively. Regularly review and refine these criteria to ensure they stay aligned with your overall sales process.
Which GTM KPIs should we split for inbound vs outbound?
When it comes to Inbound KPIs, the focus should be on tracking metrics such as the number of leads generated and meetings booked. These numbers reflect the effectiveness of attracting and converting interest into actionable opportunities.
For Outbound KPIs, the emphasis shifts to monitoring outreach efforts and reply rates. These metrics help gauge how well outbound strategies are performing in initiating conversations and engaging prospects.
The separation of these KPIs is essential because inbound and outbound activities function differently. They come with unique benchmarks and behaviors, making it necessary to evaluate their success on distinct terms.
Related Blog Posts
- The AI GTM Engineer: The Missing Role Behind Scalable B2B Growth
- Fractional CMO for Startups: The GTM Engineering Approach (Systems, Not Campaigns)
- GTM Engineering Benchmarks 2026: Time-to-First-Revenue, CAC Payback, and Pipeline Velocity for B2B SaaS
- What is a GTM Engineer: The Modern Revenue Systems Role (with Diagrams)


