
They had spreadsheets. Lots of them.
Traffic reports showing thousands of monthly visitors. Social engagement metrics trending upward. Demo request forms capturing names and emails. Every vanity metric you could want, color-coded and updated weekly.
What they didn’t have? Enough customers.
The SaaS company was burning through over $500,000 annually. Their return? Less than $50,000 in revenue from fewer than 20 paying customers. A 10:1 burn ratio that would make any investor wince.
When I asked to see their dashboard, the founder pulled up… more spreadsheets, rather than a B2B SaaS dashboard that was designed for growth. Not a single metric tracking what actually mattered: how long it took to turn a lead into revenue, how long to recover acquisition costs, or how fast deals were moving through their pipeline.
The diagnosis they got back from me wasn’t what they expected.
… They thought they needed more leads, better targeting, bigger ad spend.
But the real problem was, unfortunately, much harder to solve.
The problem wasn’t actually demand, it was conversions… and their spreadsheets were simply hiding that fact.
So, I asked for three numbers. They did not have any of them.
Here’s what makes this story particularly painful… Those three metrics: Time-to-first-revenue, CAC payback period, and pipeline velocity – They would have surfaced the problem in week one. Not nearly a decade in after millions of dollars had evaporated.
In 2026, B2B SaaS companies are facing higher customer acquisition costs (up 14% to $2.00 per new ARR dollar) and slower median growth rates (now just 26%). That’s according to Benchmarkit. Clearly efficiency is a necessity at this point…
Three metrics separate companies that are building sustainable growth vs those that are burning cash based on high hopes. Those metrics:
- Time-to-First-Revenue: How fast can you turn a lead into cash? Faster cycles = quicker reinvestment.
- SMB deals: ~40 days
- Mid-Market: 60–120 days
- Enterprise: 170+ days
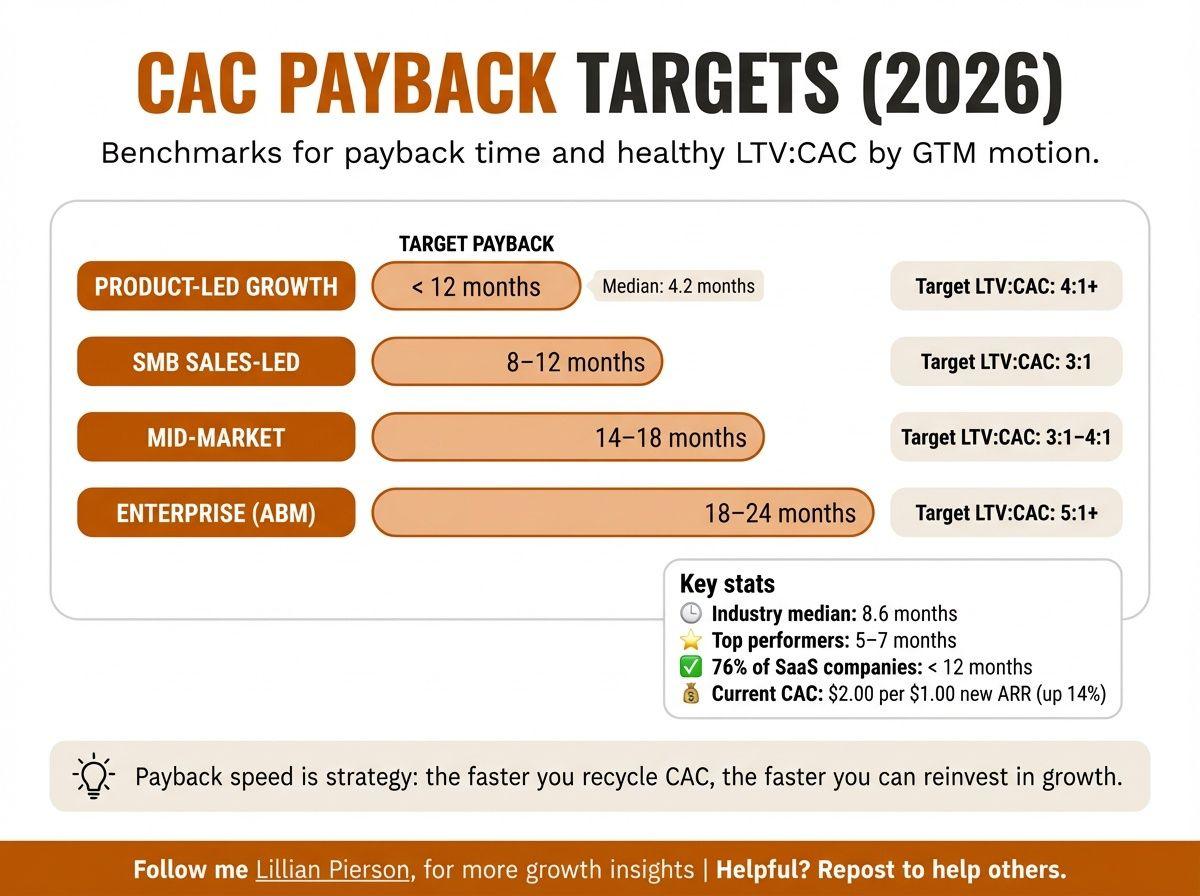
- CAC Payback Period: How long to recover acquisition costs? Median is 8.6 months, but top performers hit 5–7 months.
- Product-Led Growth (PLG): ~4.2 months
- Enterprise (Sales-Led): 18–24 months
- Pipeline Velocity: How fast is revenue moving through your funnel? The formula combines deal size, win rate, and sales cycle length. Companies that track this weekly grow 34% faster than those who don’t.
The takeaway? Align your go-to-market (GTM) strategy with these GTM engineering benchmarks. Whether you’re SMB-focused, mid-market, or enterprise, the right metrics will guide smarter decisions, faster growth, and better cash flow.
Want actionable strategies to improve these metrics? Keep reading.
2026 B2B SaaS GTM Engineering Benchmarks: Time-to-Revenue, CAC Payback & Pipeline Velocity by Segment
How to Actually Measure GTM Performance in B2B SaaS
Time-to-Revenue Benchmarks
Time-to-first-revenue measures how quickly potential customers turn into paying ones, directly influencing cash flow and the ability to reinvest. A faster time-to-revenue enables quicker capital recycling, which is especially valuable for companies that are operating on limited resources [4].
This metric also reflects how well a product fits its market. Companies that close deals quickly and show value early are often seen as less risky by investors [4]. Additionally, customers who recognize value within the first 14 days are three times less likely to churn within 90 days [9]. This makes speed-to-revenue a key predictor of long-term customer retention.
2026 Benchmarks by ACV Range
Time-to-first-revenue can vary greatly depending on deal size and the go-to-market (GTM) strategy. Below are the expected benchmarks for 2026:
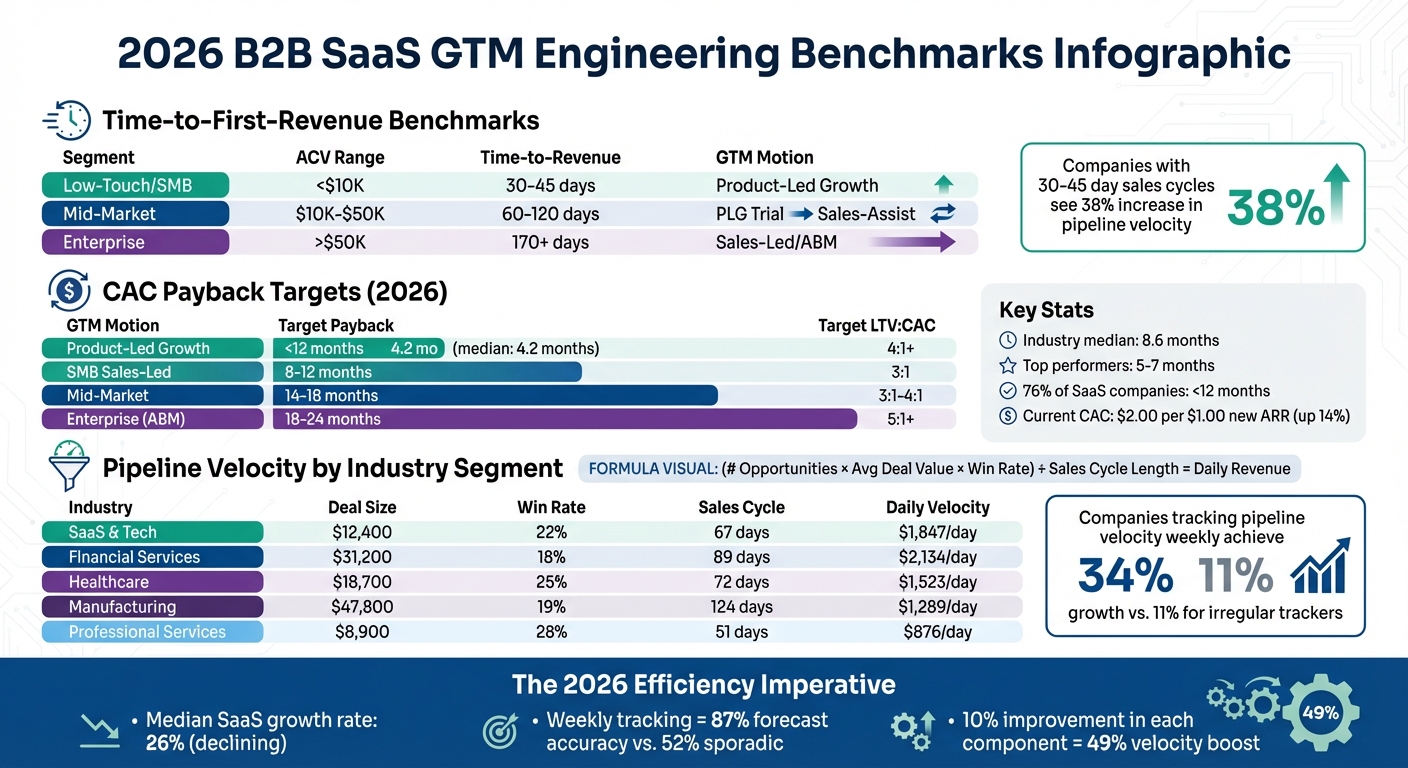
| Segment | ACV Range | Typical Time-to-Revenue | Primary GTM Motion |
|---|---|---|---|
| Low-Touch / SMB | < $10,000 | 30–45 days | Product-Led Growth (PLG) |
| Mid-Market | $10,000–$50,000 | 60–120 days | PLG Trial → Sales-Assist |
| Enterprise | > $50,000 | 170+ days | Sales-Led (SLG) / ABM |
For low-touch deals, the median sales cycle is around 40 days [3], with implementation typically taking less than 30 days [9]. Mid-market deals usually close within 60–120 days from initial contact [3]. Enterprise deals, however, often stretch beyond 170 days, with the SQL-to-close phase alone taking up to 120 days [8][9]. Companies that manage to shorten their sales cycles to 30–45 days see a 38% increase in pipeline velocity [3], which makes speed a clear competitive edge across all segments.
How to Reduce Time-to-Revenue
With these benchmarks in mind, here are customer acquisition strategies to accelerate revenue generation:
- For deals under $10,000, leverage product-led growth with self-service onboarding and free trials. This approach allows prospects to quickly discover value. Guided, interactive onboarding can boost trial-to-paid conversion rates by 400–500% compared to passive experiences [8].
- AI-driven personalization can further improve conversion rates by 18–24% [8]. For instance, in 2025, a project management SaaS company introduced a 14-day onboarding sequence. This included a Day 1 welcome checklist, Day 3 video tutorials, and Day 10 customer success check-ins. The result? Their activation rate improved from 45% to 68% within 90 days [9].
- Refine your Ideal Customer Profile (ICP) to focus on high-value prospects with shorter sales cycles [4]. Inbound website leads, for example, convert to SQLs at a rate of 31.3%, more than three times higher than outbound sources [3].
- For enterprise deals, use low-touch resources like pre-recorded demos and pricing calculators. These tools can reduce sales cycle times by 17% without lowering average contract values [3].
Common Delays and How to Fix Them
Even with optimized strategies, certain obstacles can slow down time-to-revenue. Addressing these issues can make a big difference:
- Procurement and legal bottlenecks are common in enterprise deals over $100,000. Provide technical validation documents and security reviews early to streamline the 6–9 month process [3].
- "Feature soup" confuses prospects. Listing features without tying them to tangible outcomes often leads to indecision and lost deals [8][9]. Instead, focus on outcomes. For example, swap "automated evidence collection" with "reduce audit prep time by 90%" [8]. Adding social proof or testimonials near call-to-action buttons can also improve conversion rates by 84–270% [8][9].
- Slow website performance silently hurts revenue. Ensure page load times stay under 2 seconds; sites with sub-400ms response times see double the visitor-to-lead conversion rates [8]. Simplifying forms by reducing fields by 40% or more can boost conversions by 30–50% [8].
"The faster customers experience value, the stronger your retention curve becomes. This is the most underrated growth lever of all."
- High-friction onboarding delays revenue realization. Create a clear path to first value with onboarding checklists, product templates, and in-app guides designed to be completed within 14 days [9]. Tailor the experience: self-serve users need speed and automation, while enterprise customers benefit from white-glove support [9].
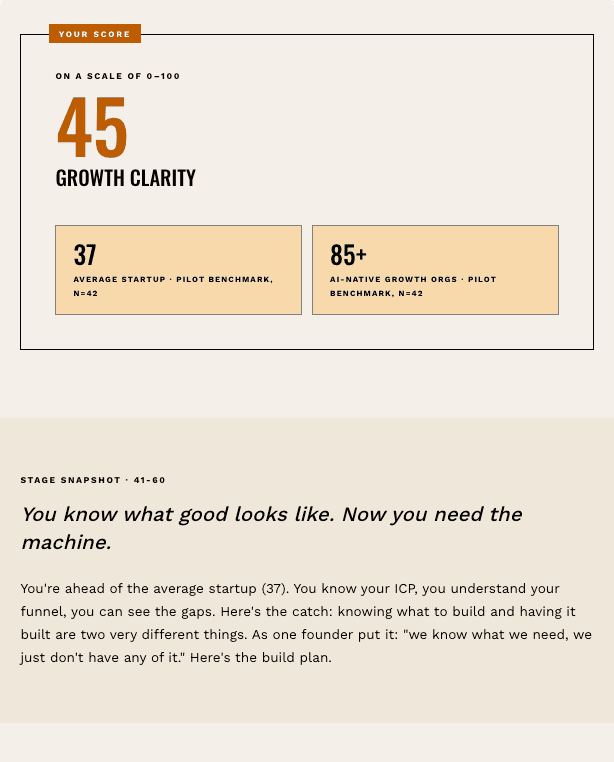
Is Your Startup Falling Behind Its AI-Native Competitors?
CAC Payback Period Benchmarks
Fine-tuning your CAC payback period is crucial for speeding up working capital recovery, allowing for quicker reinvestment into growth. This metric measures how long it takes to recoup the cost of acquiring a customer. The shorter the payback, the more cash flow you have to fuel expansion [12].
The formula is simple: divide your customer acquisition cost by the product of monthly average revenue per user (ARPU) and gross margin [10]. However, if customers churn before you recover the acquisition costs, your unit economics take a hit [10].
"A shorter CAC payback period means faster growth potential and more working capital to reinvest in your business." Drivetrain [12]
Here’s the part that surprises most founders… Their growth teams are probably not designing experiments around CAC benchmarks before committing to a GTM motion. They pick a channel, scale it, and only then discover their payback period is 18 months when the market standard for their segment is 8.
By that point, they feel stuck with it.
The smarter play? Treat every GTM motion as a bounded experiment with a CAC target set before you scale. Run a 30-day test with a $5,000 budget. Calculate your actual payback. If it’s within striking distance of your benchmark, optimize and scale. If it’s not, kill it and test something else.
Industry Benchmarks
Currently, the median B2B SaaS company recovers its acquisition costs in about 8.6 months [2]. Top-performing companies aim for 5 to 7 months [4], and 76% of SaaS companies report a healthy payback period under 12 months [2]. Investors typically expect an LTV:CAC ratio between 3:1 and 5:1, with the target being 3.8:1 [2][14].
Payback periods naturally lengthen as companies scale. Early-stage companies (under $1M ARR) average just 2 months, while those exceeding $50M ARR can take up to 20 months. Series B and growth-stage companies typically shoot for under 18 months, while late-stage companies may tolerate up to 24 months [10][11]. If the payback period stretches beyond 24 months, it signals inefficiency that demands immediate attention.
2026 CAC Payback Targets by GTM Motion
Different go-to-market (GTM) strategies directly influence payback timelines. Product-led growth (PLG) models, for instance, recover costs about twice as fast as traditional B2B approaches, with a median payback of 4.2 months [2]. This is largely due to PLG’s lower sales and marketing overhead.
| GTM Motion / Segment | Target Payback (Months) | Target LTV:CAC |
|---|---|---|
| Product-Led Growth (PLG) | < 12 months | 4:1+ |
| SMB Sales-Led | 8–12 months | 3:1 |
| Mid-Market | 14–18 months | 3:1–4:1 |
| Enterprise (ABM) | 18–24 months | 5:1+ |
Enterprise companies can afford longer payback periods because their customers typically churn less and offer higher lifetime value [11]. For smaller deals (under $15,000 ACV), the target payback is usually 8 to 12 months, while mid-market deals ($15,000 to $100,000 ACV) aim for 14 to 18 months. Enterprise deals (above $100,000 ACV) can extend to 18 to 24 months [10].
Strategies to Lower CAC and Accelerate Payback
Start with gross margins. Cutting cloud computing expenses and streamlining support services can speed up payback by increasing the profit that’s available to offset acquisition costs [12]. On average, companies spend $2.00 in sales and marketing for every $1.00 of new ARR [5], leaving room for improvement.
Encourage upfront payments. Annual or multi-year contracts can reduce CAC payback to zero days if the upfront payment exceeds acquisition costs [12][15]. Discounts for annual billing can further incentivize this approach.
Focus on high-value customers. Shortening sales cycles and increasing lifetime value (LTV) can significantly improve payback [12][14]. Use CRM data to identify inefficiencies in your funnel and double down on the most effective lead sources.
Invest in renewals teams. Combining account management with customer success teams has been shown to boost Gross Revenue Retention rates by 4 percentage points compared to companies that don’t have dedicated renewals teams [13]. This reduces churn and stabilizes cost recovery.
Avoid aggressive discounting. While discounts can close deals, they often lead to inefficient revenue recovery and longer payback periods [12][10].
How GTM Models Influence Payback
Your GTM model plays a major role in determining how quickly you recover customer acquisition costs. Aligning your approach with your product and audience is just as critical as reducing time-to-revenue.
- Product-led growth (PLG) offers the fastest payback, thanks to lower upfront sales and marketing costs. The median PLG company sees a payback period of 4.2 months, compared to 8.6 months for traditional B2B models [2]. PLG works best for products that deliver immediate value without extensive onboarding.
- Sales-led growth requires higher upfront investments in human capital but often results in larger contract values. Enterprise-focused companies using account-based marketing (ABM) typically manage payback periods of 18 to 24 months due to longer customer retention [2].
- Hybrid models combine PLG’s cost efficiency with sales-led strategies to maximize high-value opportunities [6]. For instance, self-service onboarding can qualify leads, while sales teams focus on upselling and expansions. Even sales-led companies can shorten payback by adopting free trials, interactive tutorials, and transparent pricing [14][4].
Matching your GTM strategy to your product complexity and target audience is key. For example, Education SaaS boasts a 3.8-month median payback, while HR & Recruiting lags at 10.6 months [2]. Understanding these dynamics helps you to set realistic goals and uncover areas for improvement specific to your business model.
sbb-itb-e8c8399
Pipeline Velocity Benchmarks
Pipeline velocity plays a key role in driving revenue growth, offering a forward-looking metric that combines deal value, win rate, and sales cycle efficiency. Unlike metrics that reflect past performance, pipeline velocity gives insight into the pace at which revenue is being generated and what lies ahead [3].
For B2B SaaS companies, the median daily pipeline velocity is $1,847 [17][20].
"Revenue velocity is a leading indicator – it predicts what will happen tomorrow." Optifai Guide [20]
Here’s a breakdown of the formula, benchmarks, and some actionable strategies to improve pipeline velocity in 2026.
Pipeline Velocity Formula and 2026 Benchmarks
The formula for pipeline velocity is straightforward: multiply the number of opportunities, average deal value, and win rate, and then divide by the sales cycle length in days. The result is your daily revenue generation rate [18][19][20]. Even a modest 10% improvement in each component can lead to a 49% boost in velocity [20].
Current benchmarks for B2B SaaS companies show a 22% win rate, a 67-day sales cycle, and an average deal size of $26,265 [3][17]. The ideal sales cycle for maintaining velocity while preserving deal value ranges from 46 to 75 days [17][3]. Shortening the cycle below 30 days may shrink deal sizes, while extending it beyond 120 days can reduce velocity by roughly 35% [20][17].
Regular monitoring makes a big difference. Companies tracking pipeline velocity weekly report 34% annual revenue growth, compared to just 11% for those with irregular tracking. Weekly reviews also lead to 87% forecast accuracy, which is significantly higher than the 52% accuracy seen with sporadic checks [17][20].
| Industry Segment | Median Deal Size | Win Rate | Sales Cycle | Avg. Pipeline Velocity |
|---|---|---|---|---|
| SaaS & Technology | $12,400 | 22% | 67 days | $1,847/day |
| Financial Services | $31,200 | 18% | 89 days | $2,134/day |
| Healthcare & MedTech | $18,700 | 25% | 72 days | $1,523/day |
| Manufacturing | $47,800 | 19% | 124 days | $1,289/day |
| Professional Services | $8,900 | 28% | 51 days | $876/day |
Armed with these GTM engineering benchmarks, here are some methods to accelerate your pipeline velocity.
How to Increase Pipeline Velocity
- Focus on high-intent leads. Leads generated through SEO convert from Marketing Qualified Lead (MQL) to Sales Qualified Lead (SQL) at 51%, while cold email lists convert at less than 1% [3]. Product Qualified Leads (PQLs), which come from trial usage, often convert at twice the rate of traditional MQLs and incur 30% lower customer acquisition costs [16].
- Shorten your sales cycle strategically. Tools like pre-recorded demos and pricing calculators can reduce sales cycle lengths by 17% on average [3]. Responding to hot leads within five minutes increases conversion rates by 2.5× compared to waiting an hour [20]. Additionally, running legal reviews, security assessments, and proof-of-concepts in parallel, rather than sequentially, can cut up to 58% off the sales cycle [20].
- Engage multiple decision-makers early. Deals involving key stakeholders – such as Economic Buyers, Technical Buyers, and Champions – during the first two discovery calls have a 45% higher win rate than those relying on a single contact [21].
- Optimize the MQL-to-SQL transition. With only 15–21% of MQLs converting to SQLs on average [3], improving this handoff by just five percentage points can increase total closed revenue by 12–18% [3]. Using intent signals, like repeated visits to pricing pages, can prompt timely outreach and improve conversions [20].
Pipeline Velocity by Company Size
Pipeline velocity often scales with company size, but the relationship isn’t linear. Smaller companies tend to close deals more quickly but generate less daily revenue, while larger organizations push more dollars through their pipeline despite longer sales cycles and lower win rates.
| Revenue Range | Qualified Opps | Avg. Deal Size | Win Rate | Sales Cycle | Avg. Pipeline Velocity |
|---|---|---|---|---|---|
| $1M–$5M | 18 | $6,200 | 26% | 43 days | $687/day |
| $5M–$25M | 27 | $12,800 | 23% | 61 days | $1,303/day |
| $25M–$100M | 57 | $22,700 | 21% | 78 days | $3,484/day |
| $100M–$500M | 98 | $35,300 | 19% | 95 days | $6,919/day |
| $500M+ | 156 | $57,600 | 17% | 118 days | $12,945/day |
For smaller companies ($1M–$5M ARR), sales cycles average 43 days with a 26% win rate [17]. Mid-market companies ($25M–$100M ARR) experience longer cycles, around 78 days, with win rates closer to 21% [17]. Larger enterprises often face lower win rates due to the complexity of their sales processes and the involvement of multiple stakeholders.
How to Improve All 3 GTM Engineering Benchmarks Together
Improving time-to-first-revenue, CAC payback, and pipeline velocity at the same time requires more than isolated fixes – it’s about creating a seamless system where progress in one area lifts the others. The most successful B2B SaaS companies of 2026 have mastered this by integrating their go-to-market (GTM) operations. By combining AI-driven automation, RevOps alignment, and strategic leadership, they’ve unlocked a compounding effect that drives growth across the board.
"Your GTM System Is Stuck. AI Won’t Save It But It Will Scale It." Sangram Vajre, CEO, GTM Partners [1]
Success in GTM operations hinges on measuring what matters and executing with precision. Companies that implement AI-assisted workflows across support, sales operations, and engineering see efficiency gains that snowball over time [22]. Those adopting RevOps report a 300% faster revenue growth compared to companies that don’t [28]. Fractional CMOs play a key role in orchestrating these systems for maximum impact.
Using AI and Automation for GTM Efficiency
AI tools are a necessity. Companies leveraging AI often set GTM engineering benchmarks that are double or triple those of their peers. They achieve this by automating repetitive tasks while keeping strategic decisions in human hands [7]. AI agents now handle entire sales workflows, from outbound calling and lead qualification to CRM updates and research, which significantly cuts down on manual labor [23].
One of the most impactful uses of AI is AI lead scoring. By analyzing behavioral intent at an individual level, AI helps sales teams zero in on leads most likely to close, reducing CAC and shortening sales cycles [7][23]. In onboarding, AI-driven automation accelerates time-to-value within the first 90 days, which is critical for long-term retention and quicker revenue recognition [7].
For tasks requiring a personal touch – like contract negotiations – human oversight remains essential. Meanwhile, AI can take care of lead routing and follow-up sequences [23]. This balance not only boosts pipeline velocity but also lowers CAC by optimizing how resources are used.
Streamlining automation creates a solid operational foundation, which RevOps can amplify even further.
Aligning RevOps to Improve All Metrics
RevOps alignment eliminates silos between marketing, sales, and customer success, which ensures that all teams work toward shared revenue goals rather than fragmented departmental objectives [24][25]. Companies that align people, processes, and technology across these functions experience 36% higher revenue growth and up to 28% more profitability [27].
By mapping the entire customer journey, RevOps accelerates time-to-first-revenue, focusing on delivering "Time-to-First Value" as a key growth driver [26]. For CAC payback, alignment reduces acquisition costs by cutting redundant tools, improving marketing ROI, and increasing win rates – RevOps adopters report a 59% improvement in win rates [28]. Pipeline velocity improves through automated lead routing, faster lead response times (up to 100× faster [28]), and addressing stalled deals in the funnel.
"The real power of RevOps comes from interconnectedness and an understanding across the organization about the broader impact of their actions." Salesforce [24]
To get started, centralize all revenue-related data – products, accounts, quotes, and contracts – into a single CRM for a unified source of truth [24][28]. Standardize workflows with shared playbooks for sales, marketing, and customer success to eliminate bottlenecks [26][28]. Companies that monitor pipeline velocity weekly using RevOps dashboards achieve 34% revenue growth, compared to just 11% for those with inconsistent tracking [3].
This level of integration sets the stage for expert strategic leadership to take results even further.
Fractional CMO Support from Data-Mania
Data-Mania’s Fractional CMO services provide the strategic leadership needed to align and optimize all three GTM engineering benchmarks. By analyzing benchmark data during initial assessments, Lillian Pierson identify high-impact gaps and justify changes with clear metrics [3]. This service is particularly valuable for tech companies with marketing budgets over $1M annually, offering seasoned leadership without the expense of a full-time executive.
The service includes strategy development, execution oversight, team leadership, and KPI reporting, all designed to improve time-to-first-revenue, CAC payback, and pipeline velocity. We bring expertise in identifying effective channels and tactics, managing agencies and vendors, and hiring and mentoring teams. We ensure AI implementations and RevOps strategies are executed effectively.
For companies with smaller budgets or specific challenges, Data-Mania also offers Power Hour advisory sessions. These 60-minute consultations provide targeted marketing advice and actionable plans, giving teams expert guidance without the need for long-term commitments. It’s a cost-effective way to address pressing challenges and make immediate improvements.
Conclusion: Building Predictable Growth in 2026
Fine-tuning GTM benchmarks isn’t just about hitting targets… it’s about creating a system that fuels consistent, reliable growth. By keeping a close eye on metrics like time-to-first-revenue, CAC payback, and pipeline velocity, you can shift from simply reacting to problems to proactively addressing them. This approach allows you to catch issues early and make timely adjustments [7][1].
"Growth in 2026 will not come from doing more. It will come from measuring better." Sangram Vajre and Bryan Brown, GTM Partners [1]
The most successful companies in 2026 will prove one thing: efficiency outweighs sheer volume. For instance, with the median SaaS CAC payback sitting at 6.8 months [2], and businesses tracking pipeline velocity weekly seeing 34% revenue growth compared to just 11% for sporadic trackers [3], disciplined measurement clearly pays off. Using an aligned ROI scorecard and pipeline tracker not only reduces silos but also builds trust with investors [1].
Key Takeaways
- Start with funnel optimization: A modest 5-point improvement in any mid-funnel stage can boost overall closed revenue by 12–18% [3].
- Prioritize the MQL-to-SQL transition, as it typically converts at just 15–21%, offering the most room for improvement [3].
- Segment CAC payback by ICP tier instead of relying on blended averages. Aim for 12 months or less, with top performers achieving 5–7 months [2][4].
- Track pipeline velocity weekly in your CRM to maintain 87% forecast accuracy, compared to only 52% for irregular trackers [3].
- Keep your LTV:CAC ratio between 3:1 and 5:1 to ensure strong unit economics [7][4].
Next Steps for B2B SaaS Founders
To put these insights into action, here’s what founders can do:
- Compare your current metrics to the 2026 GTM engineering benchmarks and pinpoint areas for improvement.
- Identify the GTM motion – whether outbound, inbound, partner-led, or product-led growth (PLG) – that delivers the best results for your business, and focus your efforts there.
- If your marketing budget exceeds $1M annually and you need expert guidance to align AI tools, RevOps strategies, and team execution, consider Data-Mania’s Fractional CMO services.
- For more specific challenges or if you’re working with a smaller budget, the Power Hour advisory sessions offer 60 minutes of targeted, actionable advice tailored to your needs.
FAQs
What are effective ways for B2B SaaS companies to shorten their CAC payback period?
To shorten your customer acquisition cost (CAC) payback period, aim to boost revenue while keeping spending efficient. One way to tackle this is by increasing your average revenue per user (ARPU) and improving gross margins. This could involve focusing on attracting higher-value customers or introducing premium pricing options that align with your offerings.
On the flip side, work on trimming acquisition costs. Explore more affordable channels, fine-tune your conversion rates, and streamline your sales and marketing efforts. By striking a balance between these approaches, you can recover acquisition costs faster and set the stage for steady growth.
How can B2B SaaS companies speed up time-to-first-revenue for enterprise deals?
To speed up the time it takes to land revenue from enterprise deals, prioritize AI-powered, multi-channel outreach. This approach blends highly personalized messaging with automated follow-ups, ensuring steady communication while catering to the unique needs of each buyer.
Pair this with problem-centered deal strategies that focus on identifying pain points early on and simplifying the decision-making process. This not only keeps the deal moving but also helps close it faster.
By combining tailored outreach with a focus on solving specific problems, you can maintain momentum through the sales cycle and bring in revenue more quickly.
What is pipeline velocity, and how does it influence revenue growth in B2B SaaS?
Pipeline velocity reflects the speed at which qualified opportunities progress through your sales funnel, directly influencing how quickly your company generates revenue. For B2B SaaS companies, improving pipeline velocity means closing deals faster and driving revenue growth at a quicker pace.
Take this as an example: companies that consistently track pipeline velocity – say, every week – tend to grow much faster than those that check it sporadically or ignore it altogether. By focusing on pipeline velocity, youll enable more accurate forecasting, shorter sales cycles, and smarter resource allocation, all of which play a key role in maintaining steady and reliable revenue growth.
What are the top 3 GTM engineering benchmarks for 2026?
Based on the article, the top 3 GTM engineering benchmarks for 2026 are Time-to-First-Revenue, CAC Payback Period, Pipeline Velocity
These three metrics work together. Improving one lifts the others when you treat GTM as an integrated system rather than isolated tactics.


