

We have come a long way from the days of Rachel Carson and The Silent Spring. Over the past 50 years, our understanding of the mechanisms involved in soil, water, and air pollution has proliferated. We have taken this understanding. In many parts of the world, we have used it to build systems. Systems which successfully protect human health and the environment. It seems, though, the more we know, the more perplexing the problems become. Back in 1962, people had no idea that industrial air emissions would cause our planet’s ice caps to melt. How could we have imagined that, in just 50 years, we would be grappling with problems of such devastating proportion? We could not.
Alas, it is now 2014 and here we are, amid environmental problems of global magnitude. Although industrial and urban air pollution problems have reached critical mass, there is a small and brilliant group of hard-working atmospheric scientists that are on the forefront of the fight against air pollution and global warming. Dr. Jerome Brioude, of Cooperative Institute for Research in Environmental Sciences (CIRES) at the University of Colorado, is one of these noble scientists. As part of his work with colleagues at National Ocean and Atmospheric Administration (NOAA), he has been working to achieve a more accurate, deeper understanding of industrial and urban air pollution problems around metropolitan cities.
Air Pollution and the Damage Done
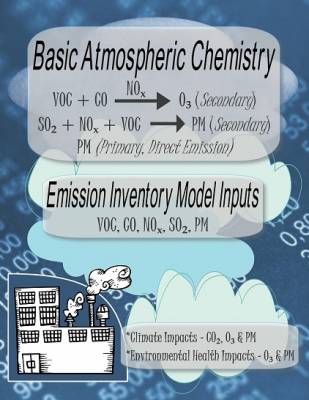
Urban and industrial air pollution harms human health and the environment. It also contributes to global warming problems. More specifically, high concentrations of ozone gas and particulate matter (PM) are known to “increase the risk of adverse respiratory effects in humans. High ozone concentrations are also damaging to crops, while high PM levels affect visibility,” Brioude says. Additionally, CO2, ozone, and PM in the atmosphere are known to contribute to the “greenhouse gas effect”, thereby increasing the planet’s propensity for global warming.
Brioude writes … “There is a scientific consensus that climate change resulting from human activities will produce profound effects on our world. It is therefore of fundamental importance to human wellbeing that we quantitatively understand the sources of compounds we produce that affect climate.” These are facts that are no longer disputed.
Although some types of particulate matter (PM) are directly emitted (primary contaminants), ozone and PM are secondary pollutants. Meaning, they form as a by-product of directly emitted contaminants instead of being directly emitted from the sources themselves. To control the production of secondary pollutants in the environment, regulators must first understand and control emissions. These emissions are of the primary, directly-emitted contaminants like VOC, CO, SO2, and NOX. The harmful impacts of primary and secondary air contaminants are obvious. The question now is, what can we do about them?
Using Statistics to Solve Environmental Problems of Global Proportion
We passed the first barrier to success. That is when we, as a global society, admit that air pollution is causing a serious problem. We also admit this problem, to which we must find some serious solutions. That is progress. But now, the hard work begins. Before we can develop viable solutions to the problems of global warming and the decline of our planetary environmental health, we must cultivate a deeper understanding of air contaminant emissions and formations in the atmosphere.
This is exactly the work that Dr. Jerome Brioude has been doing within the “Regional Chemical Modeling” group over at the NOAA Earth System Research Laboratory. Brioude and his team have been using “in situ aircraft measurements. This is along with the Weather Research and Forecasting (WRF) mesoscale model in an application of an inversion technique to estimate and improve (…measurement values…) from the US Environmental Protection Agency’s (EPA’s) National Emission Inventory (NEI).” These more accurate, updated emission measurement values result in more accurate air quality modeling and, consequently, a deeper understanding of pollutant emissions and production in the atmosphere.
What is the FLEXPART-WRF model?
The FLEXPART-WRF model used by Brioude and his group is a derivative of the FLEXPART model originally developed by Dr. Andreas Stohl. As previously published on StatisticsViews, “FLEXPART is a Lagrangian particle dispersion model. The Lagrangian air pollution dispersion model is unique because it has no fixed grid system. It instead follows the motion of computational particles which can represent either real particulates or gases. Then, it moves the particles with the large-scale winds taken from meteorological analysis or forecast data. It also has a stochastic description of motions that are unresolved in the meteorological input data. As particles disperse, and within a moving frame of reference, the model calculates statistically probable trajectories based on particle motion.”
While Dr. Stohl originally used the FLEXPART model to predict the concentration and spatial dispersion of radioactive contaminants in the environment, Dr. Brioude has coupled FLEXPART with the Weather Research and Forecasting (WRF) mesoscale model. This is so the FLEXPART-WRF model can be used to accurately predict the concentration and spatial dispersion of primary and secondary pollutants that are generated in urban and industrial areas.
What is a WRF mesoscale model?
WRF is a mesoscale model that simulates meteorological fields at spatial scales. It typically varies from 10 to 1000 km in horizontal dimension. The WRF model is a FORTRAN model that can be used to make meteorological forecasts. Dr. Brioude explains … “FLEXPART-WRF uses the wind fields from WRF to calculate trajectories. It also includes other fields (temperature, heat flux, etc…) to apply different parameterizations (for instance turbulence) to simulate processes like mixing.
The difference between FLEXPART and FLEXPART-WRF is that FLEXPART-WRF is designed to handle the different projections of the WRF output, the WRF coordinate system, and the WRF output fields to calculate Lagrangian trajectories. WRF generates meteorological fields that are necessary to run FLEXPART. FLEXPART-WRF can calculate Lagrangian trajectories backward in time (back trajectories) and their dispersion. The result of those back trajectories is the inverse model. The inverse model is used in an inversion algorithm. It estimates surface fluxes of chemical species based on atmospheric concentrations observed by different instruments.”
Updates of surface emission inventories also allow atmospheric scientists to more deeply understand the emission distributions and formations of pollutants to which global warming has been attributed. This deeper understanding is a pre-requisite to building solutions for air pollution and global warming trends that are becoming increasingly problematic.
Dr. Brioude says…
Furthering this, Dr. Brioude says … “During campaigns of observations, aircraft flight plans are sometimes designed to sample pollution plumes from different sources in urban areas (power plants, road traffic, industries, etc…). Usually, the inverse model uses the mean concentration of chemical species on 30 second intervals, which is roughly the dimension of an air mass sampled over 1km horizontally (based on the aircraft speed). The total number of 30-second intervals over an urban area is about 6,000 for a campaign of observations. The number of grid cells at the surface that are optimized by the inverse model to about 3,000.”
Dr. Brioude has written an algorithm in Matlab to perform most of the calculations on the observation data. This algorithm uses lognormal distributions, rather than Gaussian distributions, because lognormal distributions better fit the distribution of concentrations found in the observations. More specifically, the algorithm uses the “fminbnd” function to apply a gradient method that finds the minimum of the cost function by iteration. The “fminbnd” function relies upon Golden Section search and parabolic interpolation.
The FLEXPART-WRF Model is Vital to Finding Cost-Effective Control Strategies
To design the most effective solutions for gas and PM emission control, air pollution models must be based on accurate surface emission inventories. Emission control strategies for gas contaminants include scrubbing, oxidation/reduction, adsorption, incineration, condensation, and gas adsorption. Control strategies for particulate matter include centrifugal separation, settling, impaction, interception, diffusion, and electrostatic precipitation. The FLEXPART-WRF model is a tool to improve existing surface emission estimates. These estimates are based on measurements of pollutant concentrations in the atmosphere.
This ultimately allows engineers to design more cost-effective emission control strategies than they could otherwise. Updates of surface emission inventories also allow atmospheric scientists to deeply understand the emission distributions. It lets them understand formations of pollutants to which global warming has been attributed. This deeper understanding is a pre-requisite to building solutions for air pollution and global warming trends.
Sources
Brioude, J., Angevine, W. M., Ahmadov, R., Kim, S.-W., Evan, S., McKeen, S. A., Hsie, E.-Y., Frost, G. J., Neuman, J. A., Pollack, I. B., Peischl, J., Ryerson, T. B., Holloway, J., Brown, S. S., Nowak, J. B., Roberts, J. M., Wofsy, S. C., Santoni, G. W., Oda, T., and Trainer, M.: Top-down estimate of surface flux in the Los Angeles Basin using a mesoscale inverse modeling technique: assessing anthropogenic emissions of CO, NOx and CO2 and their impacts, Atmos. Chem. Phys., 13, 3661–3677, doi:10.5194/acp-13-3661-2013, 2013.
Brioude, J., Kim, S.-W., Angevine, W. M., Frost, G. J., Lee, S.-H., McKeen, S. A., Trainer, M., Fehsenfeld, F. C., Holloway, J. S., Ryerson, T. B., Williams, E. J., Petron, G., and Fast, J. D.: Top-down estimate of anthropogenic emission inventories and their interannual variability in Houston using a mesoscale inverse modeling technique, J. Geophys. Res., 116, D20305, doi:10.1029/2011JD016215, 2011.
This article was originally written by Lillian Pierson for Statistics Views website.