

What are the differences between Metrics, KPIs and Key Results? If you’re out here swinging terms like these, but you’re not actually 100% confident on what they mean, this post is for you! Keep reading to learn more about the difference between metrics, KPIs and key results, full details on what each of these important data terms means, as well as when to use them and when to refrain to improve your data lingo!

If you prefer to read instead of watch, then read on…
First things first: what does it mean to be data-driven?
At an organizational level, data-drivenness is about building tools, abilities, and, most crucially, a culture that acts on data. Individually, it’s about being empowered to make more informed decisions every day.
Becoming data-driven is a journey. If you possess most (or at least some) of these qualities, there’s a good chance you’re moving in the right direction:
- You don’t like making decisions without a clear understanding of what the data is saying.
You’re not one to rely on anecdotal or peer evidence, or a gut feeling. You use data as the core part of your decision-making process, and won’t move forward until you have data to support your decisions. - You’re adaptable and willing to change. Being data-driven means you understand that your strategy will CONSTANTLY be changing depending on what the data says. You’re okay with this and thrive in a fast-paced, ever-changing environment.
- You don’t shy away from using data tools.
You may need some help with the numbers from time to time. The reality is not everyone is an analyst. But, you ensure you have an arsenal of tools that help you manage your data and act on it. Tools that are proactive, simple, and personal.
If you’re still reading this, nodding your head, and thinking “yes, that’s me to a tee!” – let’s get into some key terms that should be in every data-driven individual’s lexicon.
The Difference Between Metrics, KPIs, and Key Results
To kick-off our discussion on the difference between metrics, KPIs, and key results – let’s start by defining metrics, then move into KPIs, then key results. Stick with us to uncover the rhythm and reason behind that ordering.
What are Metrics?
According to Oxford, a metric is simply a system or standard for measurement. A metric can be defined by one or more measures. Essentially, a metric is a communication tool, where we’re all agreeing upon the same standard.
Metrics are defined by something called unit value. The unit value is simply the quantitative value that a unit of measurement takes.
Let me illustrate with two examples.
First, let’s use a simple spatial example.
The United States is approximately 2800 miles wide. The unit value for this would be 2800, and the metric describing the width of the country would be miles.
Pretty simple, right?
Now let’s look at a more realistic example, one you might see on a day-to-day basis as a data professional.
Let’s assume you’re a Data Product Manager, and you’re reporting that your application had 50,000 daily active users.
The unit value in this scenario would be 50,000 – and the metric would be daily active users. As I mentioned before, a metric can also be calculated from more than one measure.
Going back to our spatial example, the United States contains 2.43 billion acres. Of course, the unit value here would be 2.43 billion, and the metric would be acres.
But with this example, acre could be a straight-out measure, OR it could be a calculated metric.
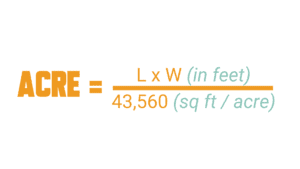
To calculate acreage, you would times length by width in feet, divided by 43,560 square feet per acre. Keep in mind, with this example you could either simply receive a report of the measurement of acreage OR you could calculate it using the formula I just provided, making it a calculated metric.
Looking back at our more practical example, let’s return to the Data Product Manager. Imagine now that the application has a 19% retention rate. The unit value here is 19%, and the metric is the retention rate. The retention rate is calculated as follows:
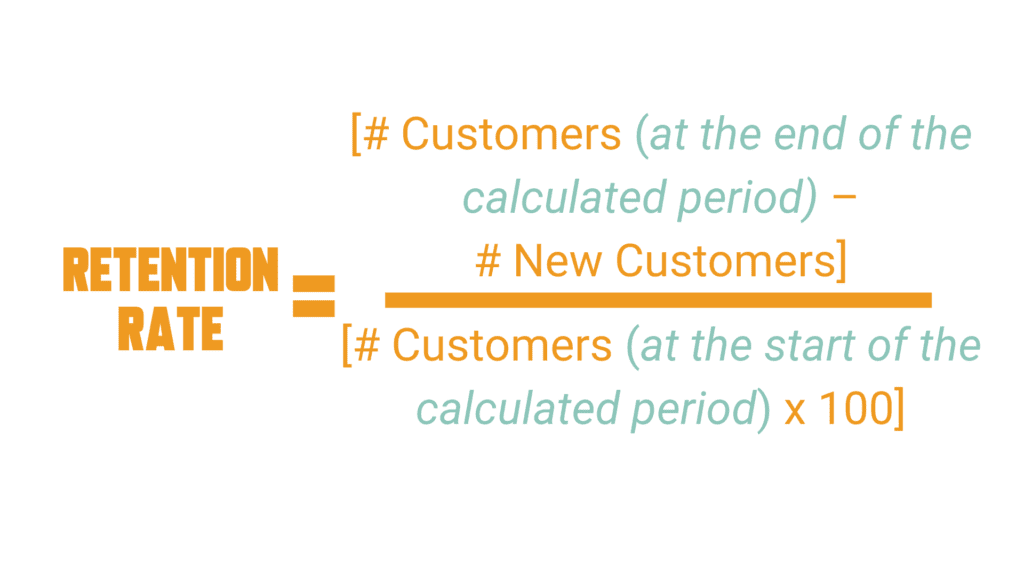
Customers at the end of the calculated period minus new customers, all divided by customers at the start of the calculated period, multiplied by 100.
Now that is definitely a calculated metric!
Now that you know exactly what a metric is, we can start looking at the difference between metrics, KPIs, and key results.
What are KPIs?
According to kpi.org, a KPI is a critical key indicator of progress toward an intended result.
Just like metrics, KPIs are also a communication tool, but they’re used to indicate progress towards a desired result.
Sounds pretty clear-cut, right? Let’s explore how you’d use this with a business example.
The first thing you need to realize is that you DESIGN a KPI in order to gauge your progress towards your desired result.
In order to design a good KPI, you have to start first by defining its five core ingredients.
- Business Objective: the desired business result.
- Unit of Measure: the metrics you use to describe the progress you’re making towards the desired business result.
- Current Unit Value: the value that your metric assumes today.
- Target Unit Value: the value your metric assumes, once you’ve reached the desired business result.
- KPI Title: you should title your KPIs according to the metrics you’ve used to measure them.
Let’s dive into an example of a KPI.
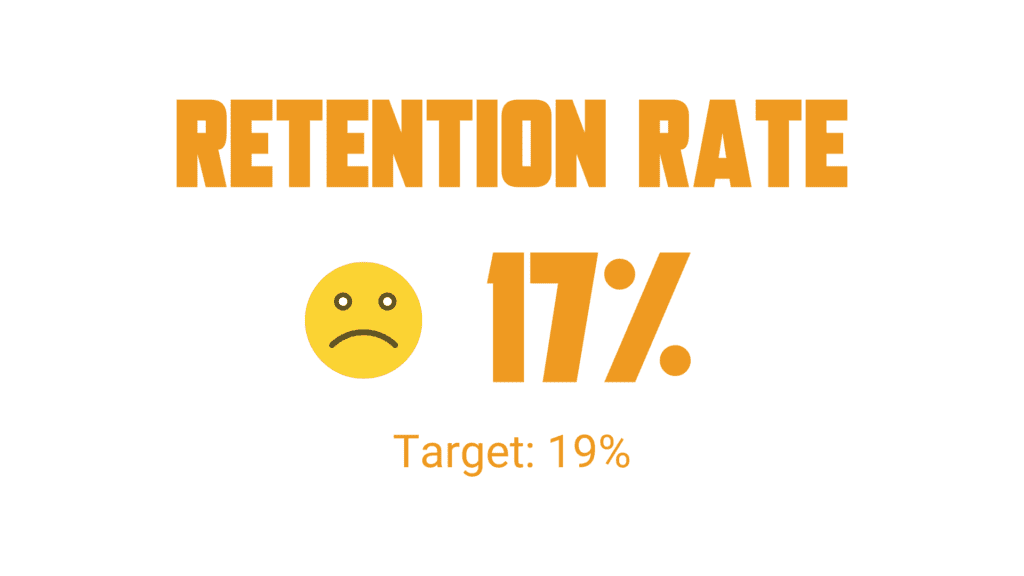
If we take the retention rate example, imagine that your target unit value was 19%. But the current unit value falls short at just 17%. In this case, the desired business result hasn’t been met.
If you’re a Data Product Manager, you’re going to be getting a thumbs down from your superiors in terms of progress results!
Any discussion about the difference between metrics, KPIs, and key results would be impossible without first introducing you to the concept of starting unit values. Let’s dig deeper into what exactly that is next, shall we?
What are Key Results?
Finally, let’s look at key results. Key results are very similar to KPIs except for one fundamental difference – that being the start unit value.
We’ll use the KPI discussion above to illustrate the difference between key performance indicators and key results.
Just like KPIs, you’ll also need a business objective (AKA, your desired business results) as well as a unit of measure (the metric you use to describe progress towards the business results).
But with key results, instead of using the current unit value, you’ll replace that with a starting unit value. Starting unit value is the value your metric assumes at the start time of the period you begin taking action towards reaching your desired business result.
They’ll also be a target unit value, which is the value of the metric when you’ve reached your desired business objectives.
The title is also a little bit different with key results than with KPIs. With key results, the title describes the entire transformation you’re trying to achieve for the business.
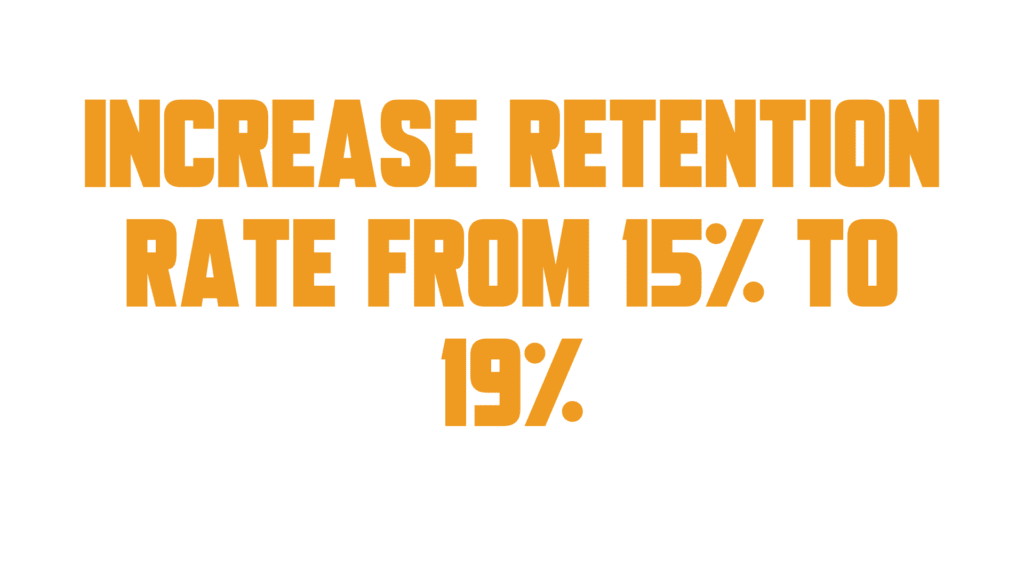
Going back to our retention rate example, let’s say our start value is 15% and our target value is 19%. In this case, the key result title would be “increased retention rate from 15% to 19%”.
All of these data terms become incredibly important when you want to put together a data strategy. It’s important you have a deep understanding so you can craft a well-executed data strategy plan, help increase business revenue for your company, and WOW your superiors.
To help you do all that and more, be sure to check out The Data Strategy Action Plan. It’s a step-by-step checklist and Trello board planner for data professionals who want to get unstuck and up leveled into their next promotion by building a fail-proof data strategy for their data projects!
Get The Data Strategy Action Plan Here

- Share It On Twitter by Clicking This Link -> https://ctt.ac/fPgdl
- Watch It On YouTube Here: https://youtu.be/9GDYqeFQZII
NOTE: This description contains affiliate links that allow you to find the items mentioned in this video and support the channel at no cost to you. While this channel may earn minimal sums when the viewer uses the links, the viewer is in NO WAY obligated to use these links. Thank you for your support!
Want a clean, repeatable system for measuring B2B growth? Get the free Growth Metrics OS — a 6-day email course for technical founders and operators who want to measure growth and make better decisions.


